Colin Barker Archive | ETOL Main Page
From International Socialism (1st series), No.55, February 1973, pp.12-14.
Transcribed & marked up by Einde O’ Callaghan for the Encyclopaedia of Trotskyism On-Line (ETOL).
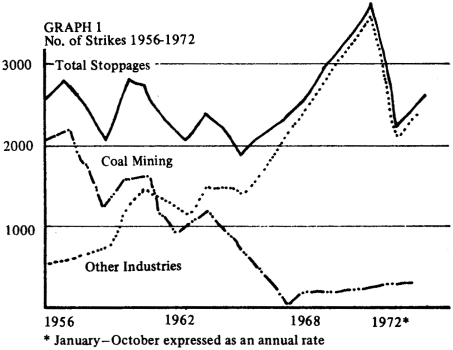
The Department of Employment’s official statistics provide extensive evidence of a sharp change in the pattern of industrial conflict in Britain over the past five or six years. One index of strike activity, the number of separate stoppages in a year, reveals contradictory tendencies. Through the 1950s and 1960s, it was necessary to differentiate between strikes in coal-mining and in the rest of industry: while the mining industry was being forcibly shrunk (and its high strike figures were falling sharply) the rest of industry was experiencing a rising trend in the number of strikes, as shown in Graph 1. By 1967, this differentiation is no longer necessary. The graph rises to a high point in 1970, and then drops quite steeply in 1971. By 1972, however, there was a strong recovery in the official strike-count. [1]
| |
Recently, the average length of strike has been rising fast: from 1962 to 1966, the average strike only lasted two days, 1969, 4.1 days; 1970, 6.1 days; 1971: 11.6 days; 1972: (Jan.-Oct.) 15 days. Similarly, the number of working days lost per strike went up by more than eight times between the 1960s and 1972.
The fall in the number of strikes in 1971 followed the defeat of the postmen’s strike in the early spring; and the recovery in 1972 came after the miners’ massive body-blow to the Tories. The number of workers involved in stoppages now compare more than favourably with the numbers for the militant period from 1919 to 1926.
As for working days lost through stoppages, these have gone upwards at a very rapid rate. From 1960 to 1967, the number of days lost in a year only once exceeded 4,000,000 – in 1962, when there were two one-day stoppages in engineering. Thereafter, the figures run as follows: 1968: 4.7 millions; 1969: 6.8 millions; 1970: 11 millions; 1971: 13.5 millions; 1972: (Jan.-Oct. only) 23.2 millions. This again is a level not seen since the great upsurge of working-class militancy that followed the First World War.
The main reason for the movement in the figures, is the growth of large, long strikes. From 1950 to 1968, the average annual number of strikes involving the loss of more than 50,000 days was just over five. In 1969 there were 20 such strikes, in 1970: 29 and in 1971: 20.
If we consider the strikes which involve the loss of a million working days or more, there were three of these in the whole of the 1960s, all of them one-day stoppages in the engineering industry, all of them token strikes. Since the beginning of 1970, however, there have already been six such strikes outside engineering, all of them of exceptional significance – miners’ strikes in 1970 and 1972, local authority workers in 1970, postmen and Ford workers in 1971, and the building workers in 1972.
Linked with the growth in the scale of strikes has been an important development: workers in the state sector have been more and more driven to industrial action. Seven of the eight largest strikes in the period before 1968 were in the private sector, but half the largest stoppages since then have been of state-sector workers.
To a large degree, the ‘revolt of the lower-paid’ that began in 1968-69. was a revolt of the state’s lower-paid. Workers in the Government sector were hardest frozen in Labour’s ‘incomes policy’. Their reactions to wage-freeze and inflation were slow, but when they came they were massive.
The old distinction between ‘official’ and ‘unofficial’ action has been increasingly blurred. In the official figures, the proportion of strikes ‘known to be official’ has been tending to rise – with catastrophic effects on some union strike funds. But many of the recent ‘official’ strikes have had considerable ‘unofficial’ elements within them.
There were two major unofficial strikes in the pits, in 1969 and 1970, before the 1972 official miners’ strike, which was itself characterised by a high level of militant rank-and-file activity, more or less independent of the union leadership. The 1972 strike, moreover, was prefaced by an extensive unofficial overtime ban.
The building workers’ strike in 1972 was turned into a national strike by unofficial action. In varying degrees, the same was true of strikes in the docks, at Fords, in the Post Office and the local authorities. In each case, the leadership was forced into giving official approval by a rising swell of unofficial action and the threat of ‘loss of control’.
Recently, trade-union membership has received a large boost. In 1948, union membership reached a postwar peak of 45 per cent density – the term ‘density’ referring to the proportion of the labour force who are actually members of trade unions. After 1948, union density dropped away to around 42 per cent. But since 1967, the trend has again been upwards: 1967: 42.1 per cent; 1968: 42.4 per cent; 1969: 43.7 per cent; 1970: 46.9 per cent.
The rise in density has been due to two factors: first, a fall in the total national labour force, due to the hidden unemployment of housewives, young and old workers who have not registered as unemployed; and second, a real rise in trade-union recruitment. Total trade-union membership rose between 1966 and 1970 by 889,000 to 11 million, a rise of almost 8.8 per cent.
There have been two major sources of this new recruitment: while-collar workers and women. The white-collar figures are especially dramatic: up to 1964 white-collar union membership just about kept pace with the expansion of white-collar employment.
Since 1964 white-collar union membership has expanded by 34.3 per cent – a larger rise in six years than in the preceding 16 years. White-collar union density, 1964-70, rose from 29 per cent to 38 per cent; by 1970 more than three out of every 10 trade-unionists were white-collar workers. As for women, their density in white-collar unions did not rise significantly faster than men’s, but in the manual unions their density rose by 7.6 per cent 1948-70, while the men’s fell by 0.4 per cent. [2]
There has also been a marked change in the stated causes of strikes since the mid-1960s. In the 1950s, the average proportion of strikes over pay-claims was only 8.8 per cent – a much higher proportion were concerned with such matters as working arrangements, rules and discipline. From 1960 to 1966, pay claims accounted for 19.6 per cent of stoppages. Thereafter, the proportion of stoppages over pay claims rose sharply: 1967: 30.1 per cent; 1968: 38.9 per cent; 1969: 49.5 percent; 1970: 55.4 per cent; 1971: 40.4 per cent.
There is an additional development that is deliberately ignored in the official statistics: each year, in its summary of the previous year’s figures, the DEP Gazette includes a footnote on stoppages of work not counted in the statistics. For many years, this footnote merely pointed out that strikes involving less than 10 workers, or lasting less than a day, were not counted unless they involved the loss of more than 100 working days. But from 1969 onwards, that little footnote has been listing another sort of strike not included in the statistical record: political strikes.
The first important political strike in Britain for nearly a generation came in April 1968, when a section of London dockers and others struck work and marched in support of Enoch Powell. There were also unofficial strikes on May Day that year. 1969 saw two stoppages, on 27 February and 1 May, against the White Paper, In Place of Strife: the Depatment of Employment and Productivity (DEP) estimated that these cost something like 160,000 working days. In 1970, 2,000 dockers struck in March against the Government’s plans for the docks; there were three strikes in November of Post Office workers against the sacking of Lord Hall; and on 8 December 350,000 struck against the Industrial Relations Bill.
In 1971, the DEP estimates that nearly four million days were lost through political strikes. These strikes were concerned with the Industrial Relations Bill and with unemployment and redundancy. The 1972 footnote, when it appears, should take note of the wide-scale strikes over the gaoling of the five London dockers, several strikes in support of the pensioners during November (notably at the BSC Anchor Site), and the stoppages in December over the James Goad case.
One thing the official figures do not reveal, is the recent and important change in the way disputes are fought. The development of the sit-in, and the extensive use of the flying picket in the miners’, dockers’ and builders’ strikes in 1972, are not recorded statistically. They are of great importance. It has been estimated, for instance, that between March and May 1972 there were 57 separate sit-ins going on. [3]
There is every reason to suppose that the new phase in the class struggle in Britain will continue, with its sharper conflicts and its much greater politicisation of strikes and pay. The pressures from the capitalist market, on both employers and workers, have forced the strike trend up. Neither Tories nor Labour have demonstrated that they can control British capitalism’s new mixture of high inflation, productive stagnation, low growth, high unemployment and weak balance of payments.
The inflationary spiral has been getting generally steeper. One factor that has recently attracted attention in this respect has been the tax system, which has been bearing more and more heavily on working-class incomes. [4] Up to the mid-1960s, the Western capitalist powers experienced a moderate and relatively steady rate of inflation averaging between three and four per cent. Only those with exceptionally low bargaining power lost out. The proportion of the population on the poverty line doubled between 1950 and the early 1960s, but the impact of this development on working-class militancy was small. But recently, western capitalism’s rate of inflation has shot up – within reach, at times, of the ‘strato-inflationary’ levels of some backward countries.
The general system of taxation has kept the wage-price spiral turning steeply. It is increasingly necessary to abandon the old and simple distinction, between money wages and real wages, which only took account of the relations between wages and prices. Instead we must talk in terms of what Jackson and his colleagues call ‘real net income’, or better, real take-home pay. This refers to the actual purchasing power of the money the worker actually receives, after tax and social insurance contributions.
In the 1960s, tax and the social insurance contribution together took only eight per cent of the average pay packet. By 1970-71, however, the average worker was losing nearly 20 per cent of his wages to the state through income tax and the ‘stamp’. [5]
The social insurance contribution amounted to three per cent of the pay packet in the 1950s, but by 1970-71 it took six per cent. As for income tax, the key factor is that wages and salaries have been rising faster than tax allowances, so that a larger and larger proportion of the worker’s pay has become liable to income tax, as shown in Graph 2. [6]
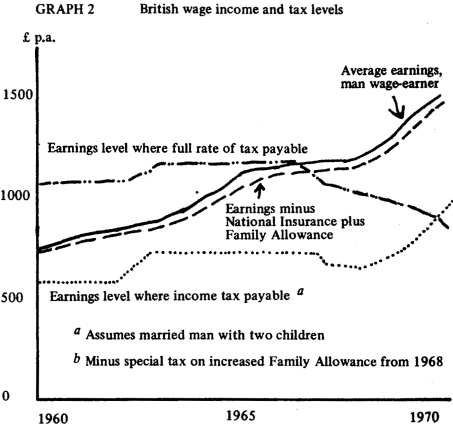 |
Not only has everyone been paying a larger and larger slice of tax, but the ‘redistributional’ aspect of taxation has been withering away, as lower-paid groups have fallen into the tax net. A man who earned £500 in 1960, and who managed to raise his wages through the 1960s to keep pace with rising prices, would have lost 5 per cent of his extra money by 1970 through income tax; but a man with £2,000 in 1960, who did exactly the same, would only have lost 3 per cent. Again, the larger the size of the worker’s family, the smaller his increase in real take-home pay in 1960-70. As the 1960s progressed, tax began to bite more and more deeply into the incomes of successively lower-paid groups of workers. Income tax, once thought of as an instrument of social justice, has turned its edge and now cuts the poor. [7]
In addition, while tax was biting more deeply into wages and salaries, it took less and less from profits:
|
Percentage of income taken as tax from |
|||
|---|---|---|---|
|
|
Corporate Profits |
Wages and |
|
|
excluding |
including |
||
|
1949-52 |
36.5 |
45.6 |
9.8 |
|
1965-68 |
19.0 |
30.9 |
15.5 |
Jackson, Turner and Wilkinson’s conclusion is brutally clear: ‘From almost every point of view, the burden of direct taxation fell increasingly on lower incomes from work.’
Due to the structure of taxation, workers’ incomes were subjected to a pincer movement. Taxes on consumption (purchase tax, etc.) rose from 17.1 per cent of total consumer expenditure in 1961-64 to 20.9 per cent in 1969-70. These rising taxes on consumption raised prices, thus cutting workers’ real incomes. As workers raised their wages to meet this tax-induced rise in prices, the other pincer, income tax, nipped off a growing part of their pay rises. [8]
This double-chop action has developed to such an extent, in a rising inflationary spiral, that the Tory Government has been able to make two ‘concessions’ in the form of cuts in income tax without significantly altering the money it has raked back in income tax. By October 1971 workers had lost all the benefit they gained in April 1971 from Barber’s tax ‘handouts’.
According to all the experts, there will inevitably be inflation in 1973 of anything up to eight per cent, before any pay-claim has even been tabled. Consider: the Common Market’s ‘common agricultural policy’ will raise the price-level by at least two per cent; Value-Added Tax at 10 per cent from April Fool’s Day will add on up to 1½ per cent; the floating (or sinking) pound sterling will raise import prices – up to another two per cent; 1973’s instalments of the ‘Fair Rents’ will add another one per cent at least. Rises in interest rates, which look increasingly likely at the time of writing (mid-December 1972) add another one per cent. To that should be added the effects of rising prices abroad on British imports – for rates of inflation are up everywhere.
For workers, the implications are all too clear. They need at least eight per cent to keep up with rising prices. As a third of any pay rise will be taken back in tax, they will need not eight but 12 per cent. But a 12 per cent general pay rise will certainly mean that the employers will raise prices: add another six per cent, on a conservative estimate, for that. Many workers pay their pensioner relatives an extra, ‘unofficial’ pension, and we should allow say two per cent for that, to meet rising prices. That’s 20 per cent.
To be completely realistic, we should also allow for the increasing cost of getting a pay rise. The average length of strike in the first 10 months of 1972 (see above) was 15 working days, or three weeks. And strikes over pay-claims tend to be longer than average. An average allowance, over the whole working class, of three per cent for the cost of strikes is hardly exaggerated. So, it seems that 23 per cent is needed. Only, we have to allow for price and tax rises on the extra that we found was needed – another four per cent for tax and five per cent for price rises. Total, 32 per cent – just to keep the working class where it is now!
In the increasingly crazy world of Edward Heath, the inequalities in the system are such, the upsets of expectations so rapid in the inflationary whirl, that anyone may at any time be in the front battalion. Nothing yet has seriously demoralised the overwhelming majority of the working class, and short of a devastatingly major confrontation there is nothing that the employers and this Government – or any potential alternative – will be able to do to control the situation effectively. 1973, industrially, has all the makings of an exciting year, and not only statistically. Socialists will have their work cut out for its potential to be realised.
1. At the time of writing, the figures for 1972 were available only up to the end of October, and I have extrapolated the trend for the first 10 months for the whole year – a procedure that may prove especially dubious in view of the ‘freeze’.
2. G.S. Bain and R. Price, Union Growth and Employment Trends in the United Kingdom, British Journal of Industrial Relations, November 1972.
3. Sunday Times, 24 December 1972.
4. Dudley Jackson, H.A. Turner and Frank Wilkinson, Do Trade Unions Cause Inflation?, Cambridge University Press, 1972, £1.20.
5. See, for instance, Brian Abel-Smith and Peter Townsend, The Poor and the Poorest, 1965.
6. Dudley Jackson et al., Op. cit., p.81.
7. This is not just a British phenomenon. The same has been happening in the USA (Jackson et al., Op. cit.). Throughout Europe, according to the OECD, there has been a fall in ‘pure’ private consumption – i.e., what a consumer spends out of his own earnings (as against his pre-tax and pre-benefit income). This fall in ‘pure’ consumption was due not to a fall in wage levels but to the larger proportion of incomes being raked back in taxation. (Economist, 18 November 1972)
8. Turner and Wilkinson (Op. cit.) estimate that Government tax rises themselves were responsible for the following proportions of overall inflation: 1960-64, 22%; 1964-68, 39.2%; 1968-69, 26.6%. They also cite a NIESR estimate that a third of the price increases, 1967-68, were due to increased indirect taxation, and a half, 1968-69.
Colin Barker Archive | ETOL Main Page
Last updated: 27.1.2008