Sealed for Half a Century: All-Union Population Census of 1937
USSR Population Distribution (1937)
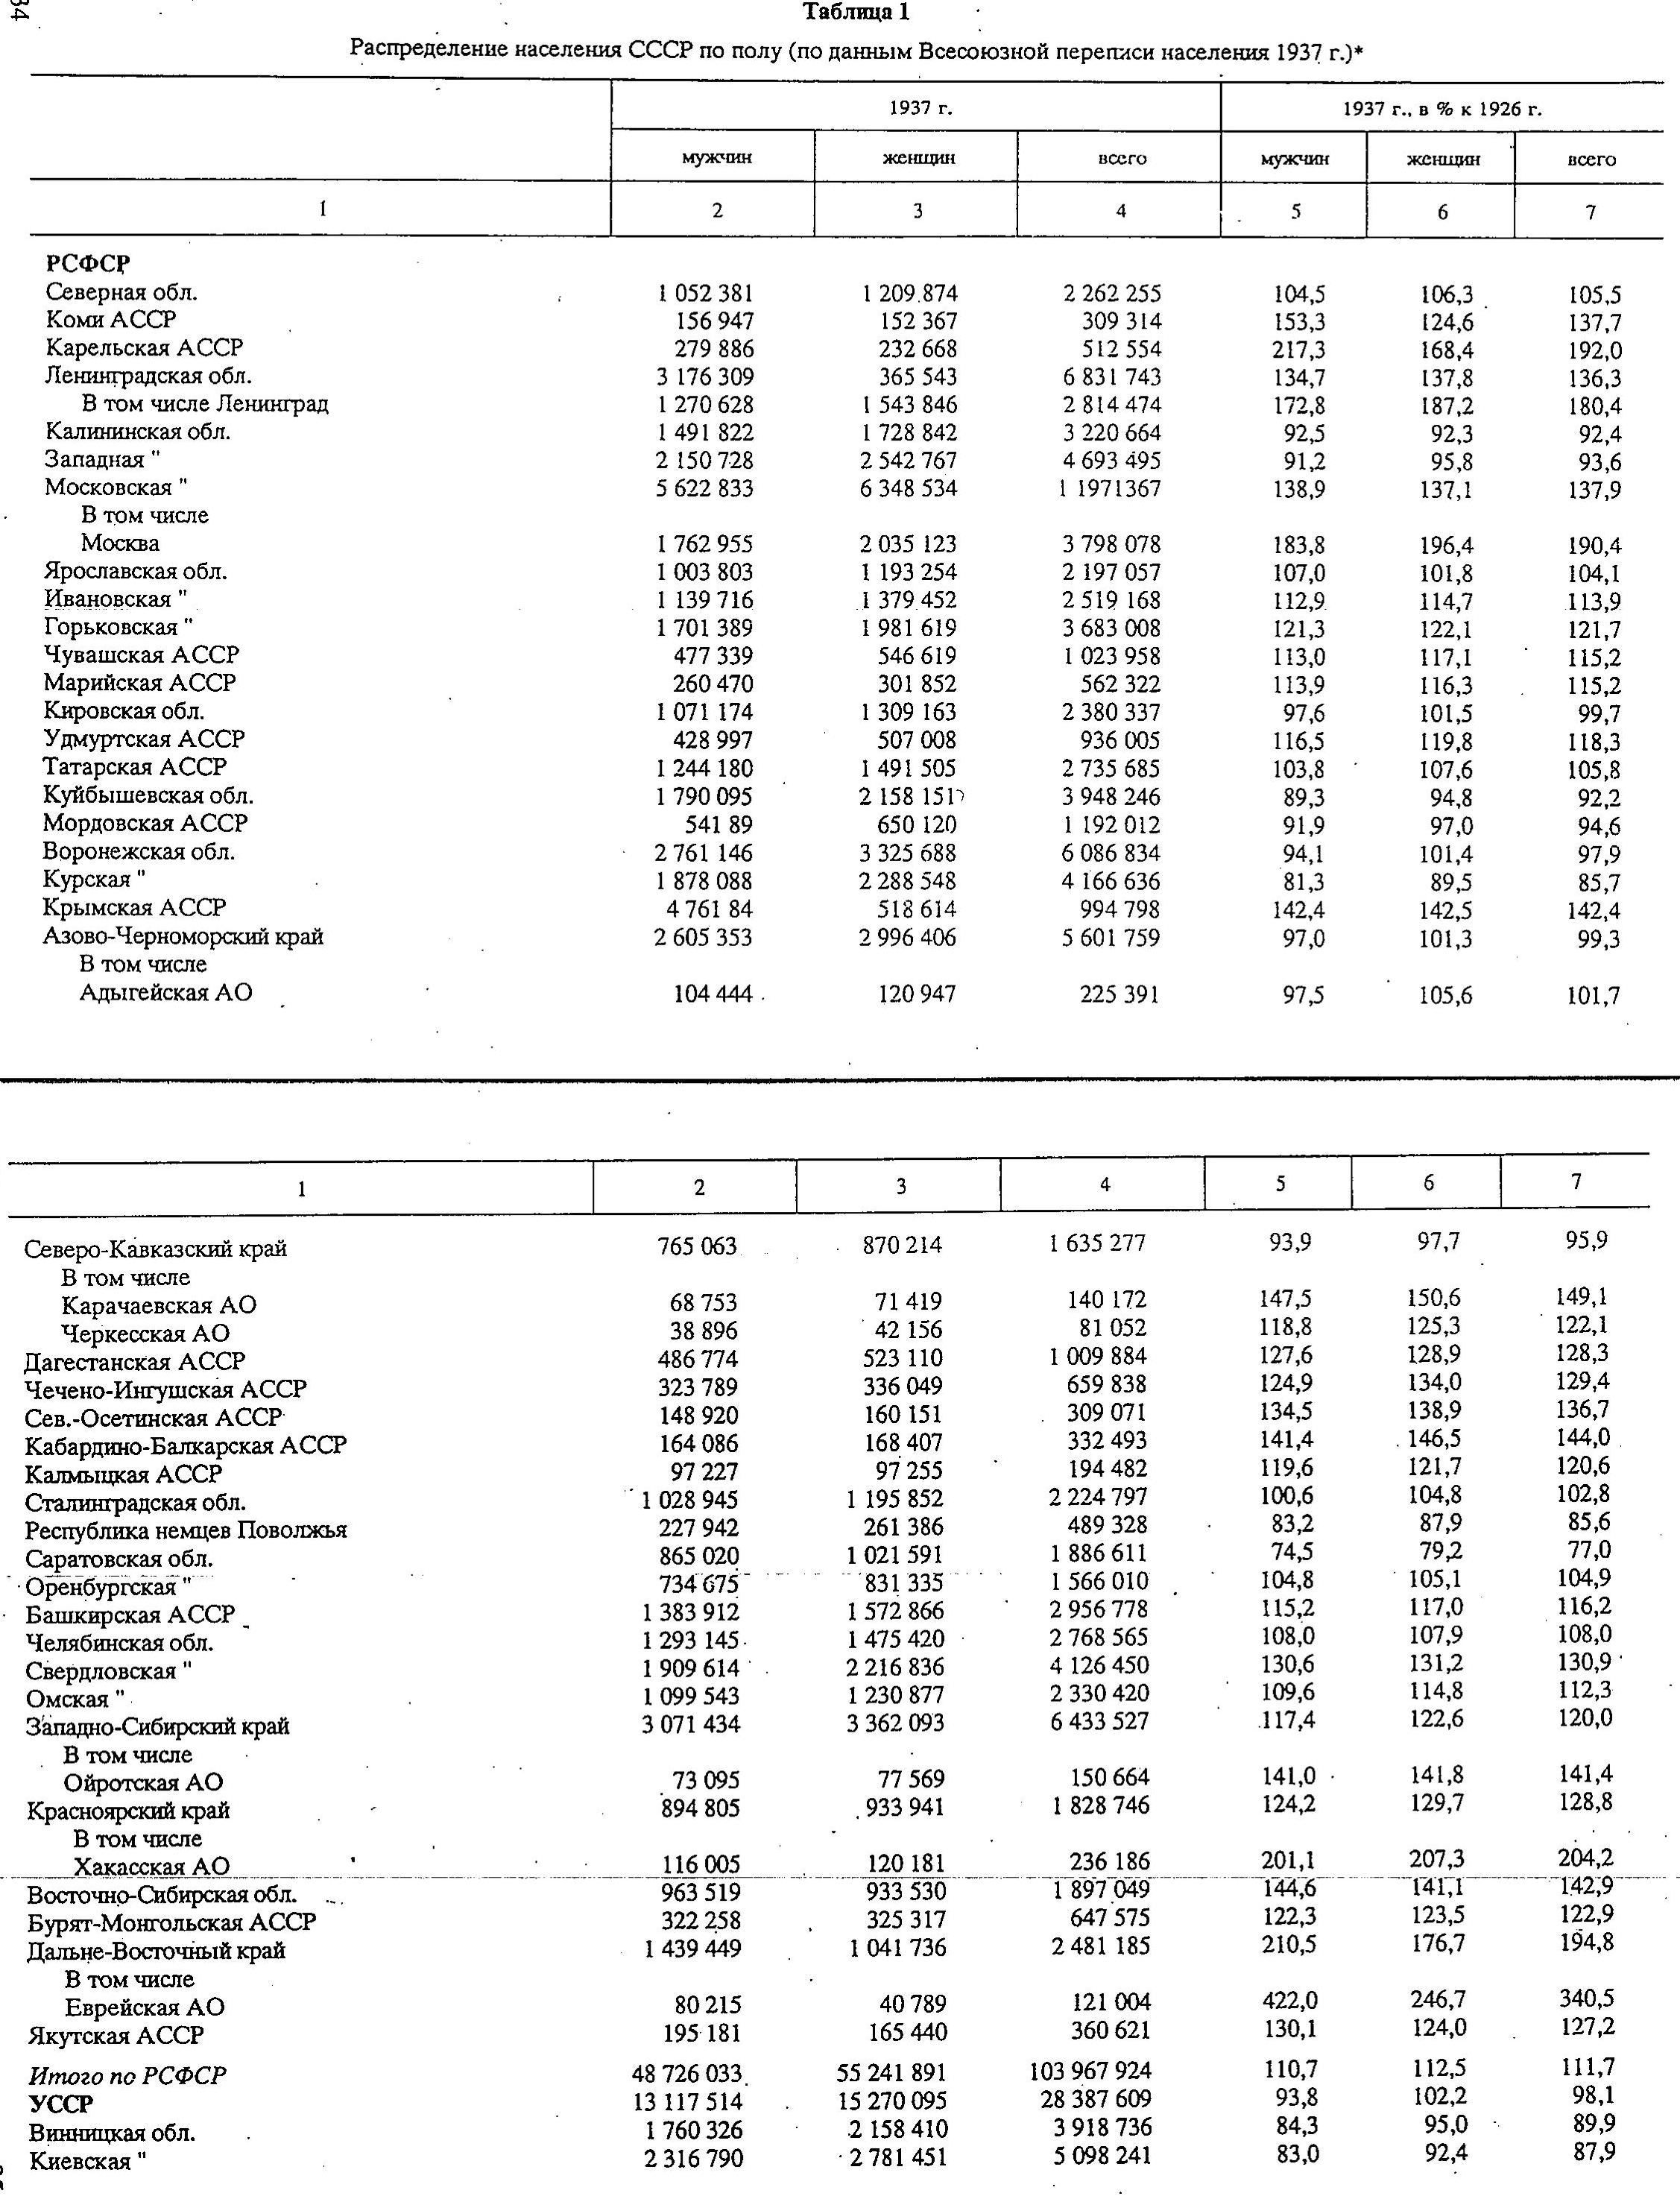
USSR Population Distribution (USSR Population Census 1937) 1937 g. 1937 g., in % k 1926 g. Region Men Women Total Men Women Total RSFSR Northern Oblast 1,052,381 1,209,874 2,262,255 104.5 106.3 105.5 Komi ASSR 156,947 152,367 309,314 153.3 124.6 137.7 Karelian ASSR 279,886 232,668 512,554 217.3 168.4 192.0 Leningrad Oblast 3,176,309 365,543[A] 6,831,743 134.7 137.8 136.3 including Leningrad 1,270,628 1,543,846 2,814,474 172.8 187.2 180.4 Kalinin Oblast 1,491,822 1,728,842 3,220,664 92.5 92.3 92.4 Western Oblast 2,150,728 2,542,767 4,693,495 91.2 95.8 93.6 Moscow Oblast 5,622,833 6,348,534 11,971,367 138.9 137.1 137.9 Including Moscow 1,762,955 2,035,123 3,798,078 183.8 196.4 190.4 Yaroslavl Oblast 1,003,803 1,193,254 2,197,057 107.0 101.8 104.1 Ivanovo Oblast 1,139,716 1,379,452 2,519,168 112.9 114.7 113.9 Gorki Oblast 1,701,389 1,981,619 3,683,008 121.3 122.1 121.7 Chuvashk ASSR 477,339 546,619 1,023,958 113.0 117.1 115.2 Mari ASSR 260,470 301,852 562,322 113.9 116.3 115.2 Kirov Oblast 1,071,174 1,309,163 2,380,337 97.6 101.5 99.7 Udmurt ASSR 428,997 507,008 936,005 116.5 119.8 118.3 Tatar ASSR 1,244,180 1,491,505 2,735,685 103.8 107.6 105.8 Kuybyshev oblast 1,790,095 2,158,151 3,948,246 89.3 94.8 92.2 Mordvinian ASSR 54,189[B] 650,120 1,192,012 91.9 97.0 94.6 Voronezh oblast 2,761,146 3,325,688 6,086,834 94.1 101.4 97.9 Kursk oblast 1,878,088 2,288,548 4,166,636 81.3 89.5 85.7 Crimean ASSR 476,184 518,614 994,798 142.4 142.5 142.4 Azov-Black Sea 2,605,353 2,996,406 5,601,759 97.0 101.3 99.3 Including Adygeyskaya AO 104,444 120,947 225,391 97.5 105.6 101.7 North-Caucasian 765,063 870,214 1,635,277 93.9 97.7 95.9 Including Karachayevskaya AO 68,753 71,419 140,172 147.5 150.6 149.1 Cherkesseaya AO 38,896 42,156 81,052 118.8 125.3 122.1 Daghestan ASSR 486,774 523,110 1,009,884 127.6 128.9 128.3 Checheno-Ingush ASSR 323,789 336,049 659,838 124.9 134.0 129.4 North-ossetic ASSR 148,920 160,151 309,071 134.5 138.9 136.7 Kabardino-Balkarskaya ASSR 164,086 168,407 332,493 141.4 146.5 144.0 Kalmik woman ASSR 97,227 97,255 194,482 119.6 121.7 120.6 Stalingrad oblast 1,028,945 1,195,852 2,224,797 100.6 104.8 102.8 German Republic of Volga 227,942 261,386 489,328 83.2 87.9 85.6 Saratov 865,020 1,021,591 1,886,611 74.5 79.2 77.0 Orenburg oblast 734,675 831,335 1,566,010 104.8 105.1 104.9 Bashkir ASSR 1,383,912 1,572,866 2,956,778 115.2 117.0 116.2 Chelyabinsk oblast 1,293,145 1,475,420 2,768,565 108.0 107.9 108.0 Sverdlovsk oblast 1,909,614 2,216,836 4,126,450 130.6 131.2 130.9 Omsk oblast 1,099,543 1,230,877 2,330,420 109.6 114.8 112.3 Western Siberia 3,071,434 3,362,093 6,433,527 117.4 122.6 120.0 Including Oirot AO 73,095 77,569 150,664 141.0 141.8 141.4 Krasnoyarskiy Kray 894,805 933,941 1,828,746 124.2 129.7 128.8 Including Khakass AO 116,005 120,181 236,186 201.1 207.3 204.2 Eastern Siberia oblast 963,519 933,530 1,897,049 114.6 141.1 142.9 Bore-Mongolian ASSR 322,258 325,317 647,575 122.3 123.5 122.9 Far-Eastern Kray 1,439,449 1,041,736 2,481,185 210.5 176.7 194.8 Including Jewish AO 80,215 40,789 121,004 422.0 246.7 340.5 Yakutskaya ASSR 195,181 165,440 360,621 130.1 124.0 127.2 Total RSFSR 48,726,033 55,241,891 103,967,924 110.7 112.5 111.7 Ukrainian SSR 13,117,514 15,270,095 28,387,609 93.8 102.2 98.1 Vinnitsa oblast 1,760,326 2,158,410 3,918,736 84.3 95.0 89.9 Kiev oblast 2,316,790 2,781,451 5,098,241 83.0 92.4 87.9
This census data contains mathematical errors. The total number of men in the RSFSR should be 48,238,330, while the total number of women should be 51,952,000. Therefore, the total number should be 100,190,330. Meanwhile, their male and female totals (48,726,033 and 55,241,891 respectively) do correctly add up to 103,967,924, and the numbers from the total column also exactly add up to 103,967,924.
How can this descrepency of 3,777,594 people be explained?
[A] It appears a decimal point was missed here. According to the total less the men, the women's total would be 3,655,434.
[B] Another missed decimal, the number should be 541,892.
This resolves the mathematical mistakes that were made, but it does not resolve the larger question. Why does census data contain two obviously mathematical mistakes, work that should be absolutely basic to any census tabulation? Is it because these were never officially published, and thus never underwent thorough scrutiny and fact checking? Does this show that this census data should be considered unreliable, and cannot be used as a reasoned basis for historical research? Is it a simple typographical error made by the source document when transcribing this data from the archives? Only serious research can resolve such questions.