Andrew Glyn Archive | ETOL Main Page
Andrew Glyn
Tumbling profits – Crumbling industry
(October 1981)
From Militant, No. 574, 23 October 1981, p. 7.
Transcribed by Iain Dalton.
Marked up by Einde O’Callaghan for the Encyclopaedia of Trotskyism On-Line (ETOL).
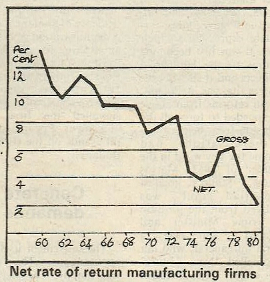
New figures for the rate of profit published by the Department
of Industry (British Business, 18 September 1981, p. 111)
confirm the dire situation faced by the British capitalists.
In 1980 their rate of profit was 4.9%, compared to an average
of 11.6% in the years 1960–65.
But the 1980 figure itself is heavily influenced by the profits
from North Sea Oil. These are of temporary duration. A large part of
them go to the American oil companies, and in any case they have no
bearing on the profitability of the rest of British industry.
Excluding these returns from the North Sea, the rate of industry
and commerce was 3.0%, barely a quarter of the level of the early
sixties. The manufacturing sector, hardest hit by the cuts in
production and the high exchange rate last year, was receiving only
2% on its capital employed.
The situation has deteriorated further this year. Figures are only
available for the first quarter, but they indicate a further fall,
perhaps to 1½% or less for manufacturing. Whilst profitability has
fallen elsewhere, the decline has been sharpest in Britain. Latest
figures (for 1979) show rates of 14% for USA, 10% for France and 14%
for Japan (British Business, 4 September 81).
The Bank of England has just reported that manufacturing
productivity rose by 3% to 4% between the end of 1980 and the middle
of 1981. But as the Bank wryly comments, part of this is probably a
statistical mirage.
If a number of the least productive plants are shut, the average
productivity level automatically rises, without signifying any
genuine gain. Indeed if the workers are thrown on the dole were
counted, their productivity having fallen to zero, the average would
certainly have declined!
While closing loss-making plants does improve profits the only
real improvement in competitiveness occurs through genuine
productivity in the more efficient plants. How much management has
achieved in this respect is an unknown quantity.
The drastic state of profitability has important implications for
the Labour Party’s expansionary Alternative Economic Strategy.
Many supporters of the AES admit that to secure an improvement in
investment the capitalists would require an increase in
profitability. But they often overlook the extent of this increase.
To return the rate of profit of industrial and commercial
companies (excluding North Sea Oil) to the level of the early 1960s
would require an increase in profits of nearly £21,000 million (1979
prices). This represent 25% of what companies are currently
producing. It would therefore take 25% expansion of their output, all
of which would go to profits, to return the profit rate to its
earlier level.
Probably there is spare capacity to increase output by a bit more
than this. Nevertheless, the restoration of profitability would take
the lion’s share of extra production.
Whether or not even this would be sufficient to secure a radical
improvement in investment is dubious enough in the context of
anti-capitalist measures of the AES (nationalisation of profitable
firms, planning agreements, etc.) But there would be huge pressure on
a Labour government to secure such a boost to profits by holding down
on any growth in living standards.
The contradiction of trying to secure production for need in an
economy based on profit would face the government with a stark
choice: Either abandon its objectives or move more decisively against
the profit system.
|
Net rate of return at current replacement price
|
|
|
All Industrial/
commercial
companies
%
|
Industrial &
commercial
companies
exc. North Sea
%
|
Manufacturing
Companies
%
|
|
1960
|
13.3
|
13.3
|
13.3
|
|
1961
|
11.4
|
11.4
|
11.0
|
|
1962
|
10.4
|
10.4
|
9.9
|
|
1963
|
11.4
|
11.4
|
10.6
|
|
1964
|
12.0
|
12.0
|
11.3
|
|
1965
|
11.3
|
11.3
|
10.6
|
|
1966
|
10.0
|
10.0
|
9.2
|
|
1967
|
10.0
|
10.0
|
9.2
|
|
1968
|
10.1
|
10.1
|
9.2
|
|
1969
|
9.8
|
9.9
|
9.1
|
|
1970
|
8.7
|
8.7
|
7.5
|
|
1971
|
8.8
|
8.9
|
7.7
|
|
1972
|
9.3
|
9.3
|
8.1
|
|
1973
|
8.9
|
9.0
|
8.1
|
|
1974
|
5.8
|
6.0
|
4.3
|
|
1975
|
4.9
|
5.2
|
3.9
|
|
1976
|
5.4
|
5.6
|
4.1
|
|
1977
|
7.1
|
6.7
|
5.8
|
|
1978
|
7.2
|
6.7
|
6.0
|
|
1979
|
6.3
|
5.0
|
3.6
|
|
1980
|
4.9
|
3.0
|
2.0
|
|
NOTE: Figures show net rate of return on capital employed. Net
Return means gross operating surplus (i.e. gross trading profits
less stock appreciation plus rent received) less capital
consumption (i.e. depreciation) at current replacement cost. Net
rates of return have fallen more than gross rates. Net rates were
above gross rates in the 1960s, but since 1974 have been well
below them, reflecting the increased share of capital consumption
as profits have fallen. Excluding North Sea activities, capital
consumption has increased from 20% of gross operating surplus in
1960 to 28% in 1979 and 56% in 1980.
|
|
|
Top of page
Andrew Glyn Archive | ETOL Main Page
Last updated: 1 November 2016