From International Socialism (2nd series), No.113, Winter 2007.
Copyright © International Socialism.
Downloaded with thanks from the International Socialism Website.
Marked up by Einde O’Callaghan for the Marxists’ Internet Archive.
What is really happening to world capitalism today? In this article I use diagrams and graphs to provide some snapshots of the present shape of the system, deliberately minimising wider theoretical issues, which I have dealt with elsewhere. [1]
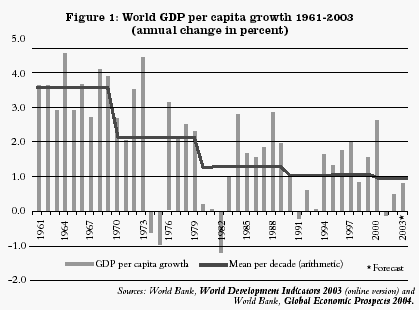
The first significant thing about the world economy is the way in which global economic growth, averaging out booms and recessions, has not only declined from the ‘golden age of capitalism’ in the 1950s and 1960s, but also from the levels known in the late 1970s and 1980s. This is shown in Figure 1. [2]
| |
The decline in growth rates has been accompanied by a continual rise in the amount of investment per employed worker – what Marx called the ‘organic composition of capital’ (see Figure 2).
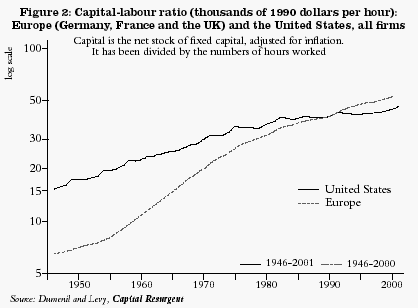 |
This ratio rises because competition between firms causes each to invest ever larger amounts in means of production per worker employed in order to raise labour productivity and keep ahead of its rivals. The amount of value that goes into investment rises much more quickly than the amount of new value created by the workforce.
Total material output may rise (assuming there is not a recession), but there is a fall in the value – and ultimately the price the producing firm gets – for each unit of output. Hence the plummeting in recent years of the prices of things produced in high investment industries like personal computers, televisions and DVD players.
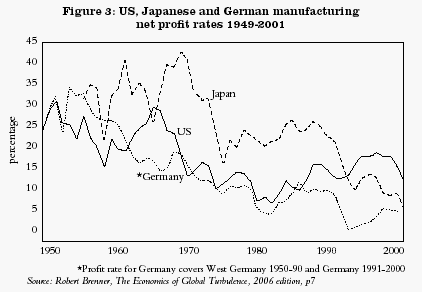
So through the system as a whole total investment rises more rapidly than value produced. But profits come from this value. There will be a tendency of the ratio of profits to investment to decline unless capitalists can increase the share of the value going to themselves rather than to workers. This is Marx’s well known ‘tendency of the rate of profit to fall’. [3] The figures for the last three decades show the tendency at work for manufacturing industry (Figure 3).
 |
Such falls in the rate of profits necessary have three consequences:
One of the most significant developments in the last four decades has been the rise of the multinationals. The top 500 multinationals dominate international business, accounting for over 90 percent of the world’s FDI and nearly half its trade.
UNCTAD reported in 1999 that ‘the world’s 60,000 multinational companies and their 500,000 local partners now control a quarter of the world’s total output, amounting to $11 trillion. More than half of that output is produced by the top 100 multinationals…’ [4] UNCTAD added in 2002 that ‘29 of the world’s 100 largest economic entities are transnational corporations’ if the output of corporations and countries is compared. [5]
Such developments have led many commentators to conclude that the multinationals are big enough not to care about the state. But this is wrong on three counts.
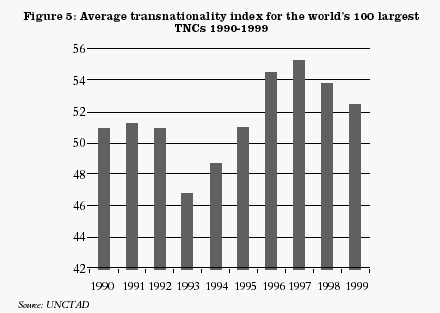
Figure 4 shows the average ‘transnationality’ of corporations, a composite measurement of the degree to which their markets, workforces and investments are outside their home country.
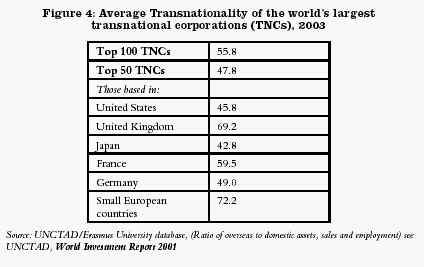 |
These figures are sometimes said to show how little multinationals depend on a national base. But in fact they show that the top 50 multinationals still rely on their home base for over half their business. And this dependence increases every time the world economy slows down or goes into recession – see Figure 5.
 |
In other words, the national state remains very important to multinationals, particularly at times of economic crisis.
Multinationals are dependent on national states to protect their global interests. There is no world state to do so. And so each looks to a state (or sometimes a group of states like the European Union) to push for its interests when it comes to trade negotiations (for instance through the WTO), exchange rates between currencies, the allocation of government contracts, protection against expropriation, the defence of intellectual property rights and the enforcement of debt repayments.
The playing field on which states seek to advance the interests of domestically based multinationals is not even.
At the top of the hierarchy are those who are most powerful in negotiations with particular trade partners, and at the bottom those who find themselves in the weakest position. The multinationals based in the states towards the top find they have a political edge over firms based towards the bottom when it comes not only to getting the best trade deals but also to important other associated issues – opening up countries to their investment, accepting their interpretations of intellectual copyright, maintaining low levels of taxation on remitted profits, getting advantageous exchange rates. [6]
The hierarchy of national capitalisms is not a static one. Economies grow at different speeds and their firms have different degrees of success in penetrating international markets and accumulating investments beyond their national bases.
The multinationals react in three ways to the shifts in the world economic pecking order of the states.
 |
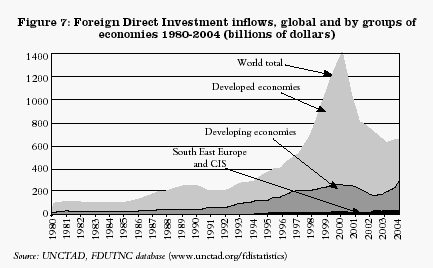
Capitalism is a system in which investment chases profit. So figures for foreign investment provide an indication of where capitalists see the most likely sources of stable, long term profitability. Figures 7 and 8 for Foreign Direct Investment provide a glimpse of where that profitability has been sought in recent years.
 |
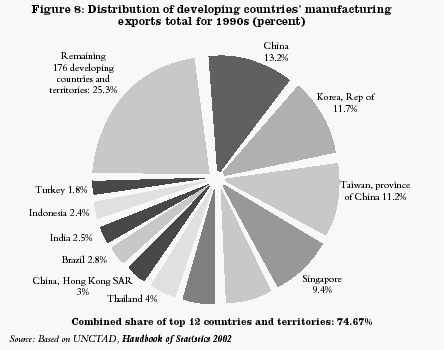 |
Figure 7 shows that on average more than two thirds of the great bulk of overseas investment has been to already industrially advanced countries – the so-called ‘triad’ of North America, Japan and Europe – with a huge upsurge towards them in the boom of the late 1990s and a falling back to a figure still twice that of the rest of the world since. These countries are not only where the wealth of the world is concentrated, but also where capitalists expect to be able to gain most profit from further exploitation. Intercapitalist competition is, above all, competition to control marketing and investment opportunities in these countries.
The old ‘third worldist’ notion that capitalism lives mainly off the exploitation of the poorer countries of the ‘Global South’ does not fit with the realities of the system today. Of course, capitalists take what they can from the poorer countries (‘every little helps’) and this has a terrible effect on the people of those countries. But it is not the most important sort of exploitation.
A third of investment is to the ‘Global South’. But here too a handful of countries are important to capital, while many are marginal to it.
Nearly half of the foreign investment to these countries (or about one sixth of worldwide investments) is concentrated in three places – China (including Hong Kong), Brazil and Mexico. By contrast the 176 poorest countries are targets for less than 8 percent of total world foreign investment. The pattern of ‘Global South’ manufacturing exports (Figure 8) shows the impact of this uneven distribution of investment.
This picture does not fully tell the story as regards capital’s interests. There is also the question of the raw materials and, in particular, oil. This is behind the strategic importance of the Middle East and, to a lesser extent at a time of high oil and gas prices, Venezuela and parts of West Africa and, often forgotten, Russia.
But the sources of the major raw materials tend to be concentrated in the same handful of states that dominate the investment statistics. People often conceive of the poorest countries as suppliers of raw materials to the richest. But the reality is very different.
The US exported more than 80 million tons of cereals in 2000-2001, Asian countries only 15 million tonnes, South American countries only 17.5 million, and African countries only 3 million. Brazil is now the world’s biggest sugar producer. The picture is not all that different with minerals. ‘Among the top 10 non-fuel mineral exporters, only two, Chile and Brazil, are less developed countries, and they ranked ninth and tenth respectively’. [7] Most countries of the Global South are dependent on their exports of raw materials and foodstuffs – but that is not the same as the global system being dependent on them for more than a fraction of its profit-making and essential imports.
So a map of the world in terms of importance for capitalist exploitation would be dominated by Europe, North America, Japan, China, Brazil, Mexico and the three or four largest oil and gas producers
Centuries of pillage by the ruling classes of the advanced countries mean that not a lot of wealth remains in vast areas of the world. It is nonsense to claim, as New Labour does, that most Third World countries can trade their way out of poverty, since they have not been left with the resources necessary to trade successfully within the system as it exists today.
In the 1980s the West European countries and Japan grew faster than the US. In the last decade it has been the other way round. The US ruling class has been able to achieve this turnaround through the use of three interrelated methods.
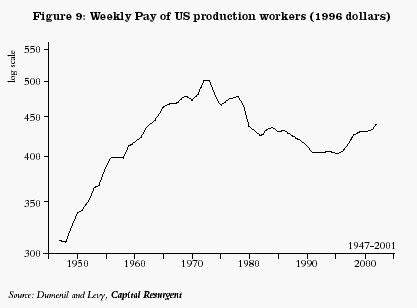
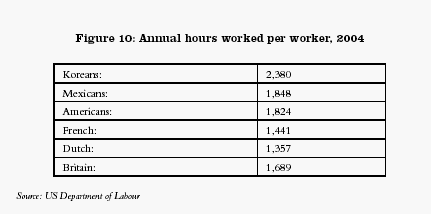
1. There has been a massive increase in the rate of exploitation of US workers. This is shown by the figures for real wages (Figure 9) and working hours (Figure 10). These are the figures give by the US Department of Labour. International Labour Organisation figures, calculated in a slightly different way, show a rise in the average working year in the US over the last quarter of a century from 1,883 hours in 1980 to 1,966 in 1997. [8]
 |
 |
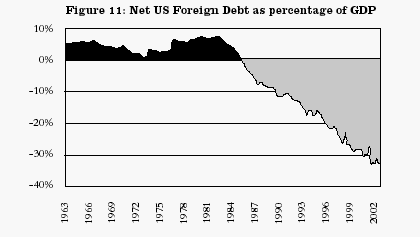
2. The US has been relying on its dominance of the world financial system – entrenched by the dollar’s role as the ‘reserve currency’ for other countries to borrow from the rest of the world – to bolster the US domestic economy. For more than a decade US consumption and investment have been rising much faster than domestic incomes or savings. The US has become the world’s largest debtor nation (Figure 11).
 |
 |
Essentially what has been happening is that national banks in Japan, China, Korea and so on have been depositing money coming in from exports to the US in US treasury bonds, which then provide the basis for banks to lend to American capitalists and consumers – and for US based multinationals to undertake overseas investment, including in the countries lending to the US.
So the US economy has been able to keep expanding, despite a trade deficit now equal to around $800 billion (about £420 billion) a year.
US investments in the rest of the world are only worth 80 percent of foreign investment in the US – but nevertheless rake in a higher total in interest and profits. In effect capitalists and governments elsewhere in the world are paying a subsidy to the US economy in return for being able keep their funds there.
Capitalists and governments are not philanthropists. They only follow such a course because of the power of the US state.
3. Such use of this state power has been the third weapon used by the US ruling class in its struggle for hegemony. Its ideology may be neoliberal, but its practice at home has been rather different. It has been using the state to intervene in financial and economic matters to push through measures that protect the domestically based multinationals and banks, even while it demands other economies turn to neoliberal measures that reduce the role of their states.
European capitalism finds itself under pressure on two fronts. On the one side there is increasing competition from the Far East. Not only has China emerged as a major competitor across a wide range of industries – importing components from Japan and the ‘tiger’ economies, putting them together and then competing with European products elsewhere in the world. But Japanese capitalism has continued investing over the last 15 years, despite the stagnation of the Japanese economy.
On the other side is the pressure that comes from US-based capitalism, with its three decades of a rising rate of exploitation of its workforce. So although some of the mainland European countries have succeeded in raising their output per hour worked until it is higher than that in the US, the longer hours worked in the US mean that its output per worker is still considerably higher than Europe’s.
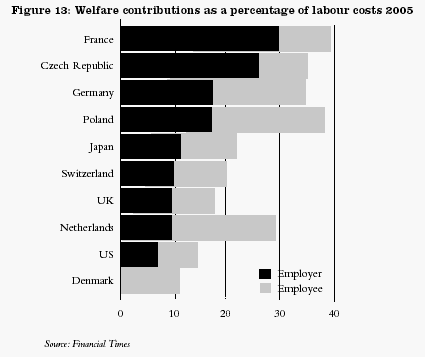
This has been happening while European capitalists face the same pressure on the rate of profit as elsewhere. And their problems are aggravated by the means they used to maintain political stability in the aftermath of the Second World War – the institutionalisation of ‘social partnership’ through collaboration with the union bureaucracy, cemented by concessions to workers in terms of working hours, rights at work, welfare provision, pensions and so on. As Figure 13 shows, they are paying much more for welfare provision to maintain social peace than their American rivals.
 |
All this creates political difficulties for them when they go on the offensive to increase their own rate of exploitation. But they feel they have no choice but to do so if they are going to protect their position in global markets. Hence they pressurise governments to implement neoliberal policies at home while they try to soften up their workforces by threatening to move production to Eastern Europe and elsewhere.
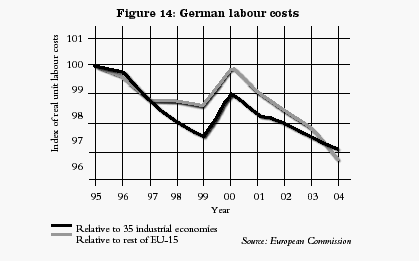
Germany is the biggest European economy – and still the world’s biggest exporter. But German capitalism has had to turn on its workers in order to try to preserve its position. The BBC could report last year, ‘Real wages have fallen dramatically and working hours are nearly back to 40 a week – to the point where some employers say they don’t see much difference between the cost of hiring a German or British worker’. [9] What has been happening to German workers is shown clearly in Figure 14.
The same logic is at work for capitalists based in France, Britain, Italy, etc. They are faced with competition from capitalists based in the US, Japan, the East Asian tigers and China, all of which benefit from working hours at least 300 hours more than those in France and Germany. They will respond with one offensive after another against what they conceded to workers in the past to maintain ‘social peace’ – and the result could well be outbreaks of class struggle on a scale not known for decades.
 |
The scale of US debt has provided an additional boost to financial speculation. Investors always look for quick profits elsewhere when there is downward pressure on profit rates in productive sectors of the economy.
The last decade has seen worldwide a growing dependence on new forms of speculative borrowing and lending – derivatives (see Figure 15). These began as ways for corporations and banks to protect themselves against unexpected changes in currency exchange rates and have since developed into a form of gambling on all sorts of possible economic and financial shifts. The ‘hedge funds’ that engage in such gambling are now multibillion concerns.
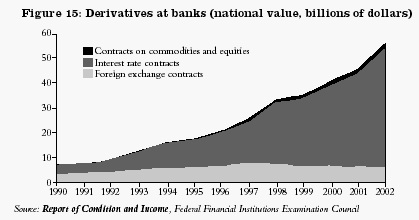 |
By mid-2004 the total value of the derivatives traded had already grown until it was more than six times the total GDP of the whole world. The derivatives market, because it is a global market, escapes regulation by any national government. There are recurrent fears in business circles of the damage to the financial system that would occur if there were a major mishap in the derivatives market, such as forced the bail-out of Long Term Capital Management eight years ago.
A real and massive expansion of the Chinese economy has been taking place. But there are fears that it is being accompanied by some of the symptoms of a classic capitalist bubble.
The very high levels of investment are not matched by anything like the same rate of growth of the employed labour force: ‘Between 1978 and 1993 employment expanded by 2.5 percent per annum, but between 1993 and 2004, when the investment share of GDP was much higher than in the 1980s, employment growth slowed to only slightly over 1 percent’. [10]
There is strong evidence that the rising ratio of capital investment to workers is exerting a downward pressure on profits, which is exacerbated by the competition between different firms (each linked to different multinationals) to get rid of excess supplies of goods. But these pressures on profitability are concealed by the willingness of the banking system to take on an ever greater number of bad debts. The official figures for ‘non-performing loans’ in the Chinese banking system vary between the official figure of 20 percent of the total loans, and some unofficial estimates suggesting they amount to 45 percent of GDP. [11] The potential for a massively destabilising crisis in the medium term is enormous – and the crisis would have an enormous impact on the whole world economy.
For the moment, though, Chinese growth is having more immediate effects on capitalism elsewhere. The massive growth has led to a sucking in of raw materials from elsewhere, pushing up the prices that firms everywhere in the world have to pay for them. At the same time the flood of consumer goods from China is exerting a downward pressure on the prices of consumer goods that these firms want to sell. This pressure exacerbates the problems world wide arising from the long term tendency of profit rates to decline.
It is impossible to foresee how the contradictions shown in these snapshots work themselves out. But the key thing is not to pontificate over whether there will be another slump in the near future (even if it is worth noting that the old cycle with recessions roughly every ten years seems to have re-emerged since the early 1980s). Much more significant is the political impact such contradictions are bound to have.
Figures for arms expenditure show the political-military tendencies that are built into the system today more than anything else (Figure 16).
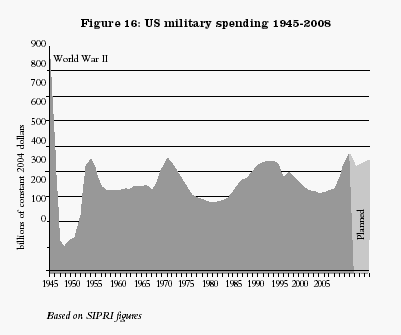 |
But it is not only US military spending that is rising, even though it dwarfs that of other powers.
There are currently two great belts of political instability. There is that stretching across sub-Saharan Africa. And, more important for the system as a whole (though not for the millions who have suffered from Africa’s wars), there is the one stretching eastwards from the Mediterranean to the Indus and northwards into central Asia. We can expect the dynamics of intercapitalist competition to produce more military conflicts and political earthquakes as nationally based multinationals battle for survival in an unstable global economic system.
There will be the sudden explosion of political crises – and with them sudden splits within and between ruling classes. Lenin defined a ‘pre-revolutionary situation’ as one where the mass of people could not tolerate the old conditions any more, but neither could the ruling class. Bitter divisions within its ranks could suddenly snap the repressive and ideological ties holding the mass of people in check, allowing long concealed bitterness to come to the surface.
We are nowhere near that state of affairs today in any of the developed capitalist countries – nor for that matter in overwhelming majority of the less developed ones. But we have seen a few notable examples of Lenin’s model in recent years, producing, if not full blown revolution, enormous popular mobilisations and political crises – Indonesia, Ecuador, Bolivia, Venezuela, Nepal, and most recently the southern Mexican city of Oaxaca. The ‘snapshots’ suggest that we will see many more in the decades ahead – and not only in places that are peripheral from the point of view of those who run the world system.
1. See my book, Explaining the Crisis (Bookmarks, 1984 [reissued 1997]), based upon four pieces from this journal in the early 1980s, and my articles, Poland and the Crisis of State Capitalism, International Socialism 1:94 and 1:95 (1977); Better a Good Insight than a Bad Theory, International Socialism 1:100 (1977); Where is Capitalism Going?, International Socialism 58 and 59 (Spring & Summer 1993); The State and Capitalism Today, International Socialism 51 (Summer 1991), available at www.isj.org.uk; Globalisation, International Socialism 73 (Winter 1996); Analysing Imperialism, International Socialism 99 (Summer 2003); and China’s Economy and Europe’s Crisis, International Socialism 109 (Winter 2006).
2. The diagram has been used before in this journal – see Alex Callinicos, Making Sense of Imperialism: A Reply to Leo Panitch and Sam Gindin, International Socialism 110 (Spring 2006).
3. I remind readers with more than a basic knowledge of Marxist economics that I am putting things as simply as I can here. For a much fuller discussion of the tendency of the rate of profit to fall and the countertendencies, see my Explaining the Crisis, as above, chapter one.
4. BBC report, 28 September 1999.
5. UNCTAD press release, on www.unctad.org/Templates/webflyer.asp?docid=2426&intItemID=2079&lang=1 [No longer available online].
6. For an attempted depiction of this hierarchy, see Valentino Piana, Hierarchical Structures in World Trade, Economics Web Institute (2004), http://www.economicswebinstitute.org/main.htm.
7. John T. Thoburn, Tin in the World Economy (Edinburgh 1995).
8. www.ilo.org/public/english/bureau/inf/pr/1999/29.htm. International Labour Organisation figures. The figures given by various sources vary considerably, depending on how they count part time working and whether they take into account unpaid overtime. So the OECD figures do not show the rise in the US working years, while other measures, based on reports from firms, show it as rising much more than do the ILO figures.
9. BBC report, 5 September 2005.
10. Kuijs and Wang, quoted in Nicholas R. Lardy, China: Towards a Consumption-Driven Growth Path, Policy Briefs in International Economics (October 2006).
11. For a fuller discussion of the contradictory pressures in the Chinese economy, see my China’s Economy and Europe’s Crisis, International Socialism 109 (Winter 2006).
Last updated on 7 May 2021