Figure 1: Trade union membership figures, 1975–2005/6
Source: Mercer and Notley, 2008
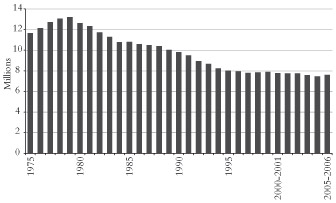
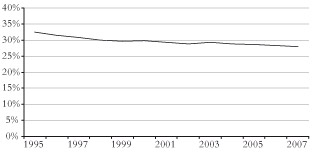
Figure 2: Trade union density, 1995–2007
Source: Mercer and Notley, 2008
From International Socialism 2 : 120, Autumn 2008.
Copyright © International Socialism.
Downloaded with thanks from the International Socialism Website.
Marked up by Einde O’Callaghan for the Marxists’ Internet Archive.
Workers in Britain face the twin crises of recession and inflation with union organisation that has, in general, been on the retreat for nearly 30 years. A complacent attitude to the problem of rebuilding union strength and organising new groups of workers would clearly be misplaced. However, the frequently repeated claim that unions have declined to the extent that they no longer matter is also false. The strengths, as well as the weaknesses, are brought out by the latest survey published by National Statistics. [1]
Two slightly different sets of figures show the long-term decline in union strength. The first gives overall union membership since the mid-1970s as calculated by the Certification Office (figure 1). The second gives the density of union membership (the proportion of workers belonging to unions) based on the Labour Force Survey (figure 2). [2]
|
Figure 1: Trade union membership figures, 1975–2005/6 |
|
|
|
Figure 2: Trade union density, 1995–2007 |
|
|
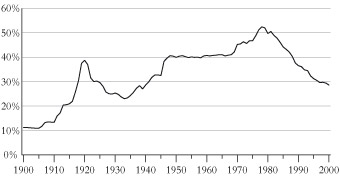
These figures need to be seen in a long-term perspective. Despite the decline, the proportion of workers in a union remains higher than it was just before two of the great upsurges of class struggle in the 20th century: the Great Unrest and the explosion of militancy in 1919-20. This is shown clearly by figure 3.
|
Figure 3: Proportion of workers in a union, 1900–2000 |
|
In fact, the only period with a sustained union density higher than today was that of the long post-war boom and the few years that followed the end of this boom.
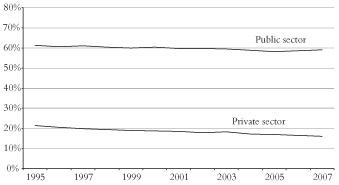
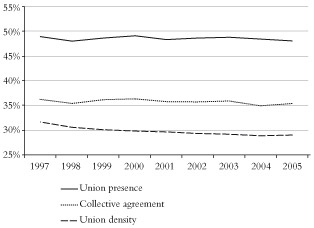
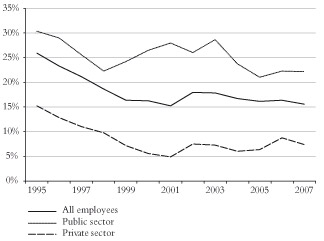
The media makes much of the weakness of unions in the private sector, in which only about one in seven workers are unionised. Membership is certainly lower here than in the public sector (see figure 4). The media interprets this as meaning that unions in the private sector are powerless. But the figures for union density alone can underestimate the spread of membership and influence. This is shown by the relatively high proportion of workplaces covered by collective bargaining agreements and the still higher proportion (close to half) with some union members in them (figure 5).
|
Figure 4: Union density by sector, 1995–2007 |
|
|
Figure 5: Union density, presence and collective agreement coverage |
|
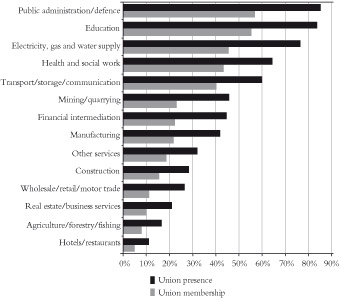
A more detailed look at the figures, industry by industry, shows that some important parts of the private sector have high concentrations of union membership (figure 6). Over 40 percent of workers in electricity, gas and water supply, and in transport, storage and communications are unionised. Some union members are present in 75 percent and 60 percent of workplaces in these industries respectively.
|
Figure 6: Union density and presence by industry, 2007 |
|
The position is far worse in manufacturing, where a little over 20 percent of workers are in unions (about the same proportion, surprisingly, as in “financial intermediation”). The relatively low figure for manufacturing reflects the loss of two thirds of the jobs in the sector since the early 1970s, with the closure of such bastions of union organisation as the Sheffield steel industry, Rover in Birmingham and the Ford assembly plant in Dagenham. Unionisation still exists among Britain’s three million remaining manufacturing workers (including in the car industry, which has as high an output as before, but which is now largely concentrated in Japanese owned plants with few traditions of militancy). More than two in five manufacturing workplaces contain some union members, and 30 percent of “process, plant and machine operatives” are union members. [3]
|
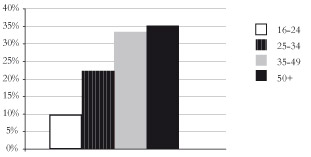
Figure 7: Trade union density by age |
|
Three very important interrelated factors influence the likelihood of someone being in a union. The first is age (figure 7). Middle-aged workers are one and a half times as likely to be in unions as those in their late 20s and early 30s – and more than three times as likely as young workers.
|
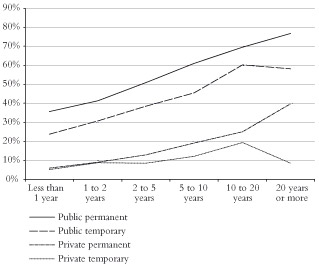
Figure 8: Trade union density by length of service |
|
The chart giving union density for people who have been working in the same place for different periods of time shows a similar pattern (figure 8). In both the private and public sectors, workers who have been in the same job for ten years are much more likely to be union members than those with only one year’s service. For those who have been in private sector jobs for 25 years, that is, since before the defeat of the miners and print workers in the mid-1980s, membership rates are comparable to those during the long boom of the 1950s and 1960s.
This trend is important. It means that traditions of unionisation still exist within the workforce and with them the potential for unions to regain their old strength. One other important set of figures confirms this – those measuring union strength by size of workplace. Table 1 gives the data for England – similar figures apply elsewhere in Britain.
|
Table 1: Union density by size |
|
|
Workplace |
Union density |
|---|---|
|
Less than 50 |
16.6 |
|
50 or more |
35.7 |
In medium and large workplaces average union membership still remains at a high level, despite the relatively low level of strikes in the past two decades compared with the two decades before them.
Recent figures for union membership also dispel another widespread myth: that the unions are a male domain (a myth summed up by some middle class feminists in the 1970s who talked of unions being the “men’s movement”). Today female workers are more likely than male workers to be union members – with a union density of 29.6 percent compared to 26.4 percent for men.
Another widespread claim is also proven to be mistaken: that part-time workers form an “insecure” or “precarious” layer in the working class which cannot be organised. Most part-time workers are, in fact, permanent workers. More than two out of every five are union members. Table 2 breaks down the figures for union density.
|
Table 2: Union density by gender and by part-time/full-time status, UK, Q4 2007 |
|||||
|
|
All Workers |
Gender |
Status |
||
|---|---|---|---|---|---|
|
|
|
Male |
Female |
Full-time |
Part-time |
|
Union density |
28.8 |
26.4 |
29.6 |
30.1 |
21.9 |
Other figures show that even workers who really do suffer from temporary employment can be unionised – ”precariousness” is not an absolute barrier to organisation. Some 16 percent of temporary workers are union members – 34.8 percent of those in the public sector and 6.7 percent of those in the private sector. Here the figures point to both a potential for organisation and the low level of its realisation.
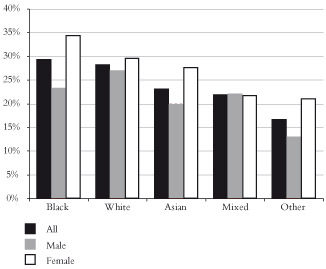
Unions are also far from being organisations of a supposed “white working class”. Union density is at a similar level for black and white workers, and is only a few percent lower for Asian workers. The most strongly organised group are black women (figure 9).
Figure 9: Union density by gender and race, 2007
Source: Mercer and Notley, 2008
Workers of all sorts gain significantly from union membership. Average earnings for union members are 15 percent higher than for non-union members – although the difference is greater in the public than private sector. Figure 10 gives the “wage premium” – the percentage difference in average hourly earnings for union members and non-union members.
|
Figure 10: Average union “wage premium”, 1995–2007 |
 |
Union membership is unevenly distributed within Britain’s working class today. That does not only apply to the gap between the public and private sector union presence. There is also unevenness between those employed workers for whom life under capitalism is very bad and those for whom it is slightly better – with those for whom it is worse having, on average, the lowest levels of union organisation.
National Statistics groups together different occupations into various categories. Those with the highest levels of union organisation are those just below managers in its scale: the occupations it labels “professional” and “associate professional and technical occupations”. These are rag bag categories, drawing together quite different occupations. So the “professionals” include all teachers as well as doctors and lawyers, while the “associate professional and technical” include nurses and similar health service grades, social workers, computer technicians, firefighters, train drivers and lower ranking police officers.
Their level of union organisation is more than twice as high as that of “elementary occupations” (another rag bag category mainly consisting of labourers, dockers, refuse collectors and waiters, but also including postal workers and printing machine minders), and between three and four times the level of those in sales and customer service (table 3).
|
Table 3: Union density by employment category, |
|
|
Category |
Union density |
|---|---|
|
Managers and senior officials |
17.4 |
|
Professional occupations |
47.1 |
|
Associate professional and technical occupations |
41.5 |
|
Administrative and secretarial occupations |
22.8 |
|
Skilled trade occupations |
24.7 |
|
Personal service occupations |
30.4 |
|
Sales and customer service occupations |
12.2 |
|
Process, plant and machine operatives |
29.9 |
|
Elementary occupations |
20.3 |
The same divergence in average levels of unionisation is shown by educational qualification in table 4.
|
Table 4: Union density by highest qualification, |
|
|
Highest qualification |
Union density |
|---|---|
|
Degree or equivalent |
36.0 |
|
Other higher education |
40.5 |
|
A level or equivalent |
22.5 |
|
GCSE grades A to C or equivalent |
22.5 |
|
Other qualifications |
21.6 |
|
No qualifications |
20.4 |
These two tables indicate the concentration of union membership in white collar public sector jobs. Groups of workers who once thought of themselves as middle class have been proletarianised in recent decades. Only 40 years ago the National Union of Teachers rejected affiliation to the TUC in a ballot. Teachers held their first strike 39 years ago. The change in attitude by such groups of workers should blow apart New Labour’s claim that the way to win support from “middle England” is to reject union demands.
However, the figures also point to the weakness of the unions when it comes to organising the traditional manual working class (which still makes up almost half of the workforce) and the growing numbers in low level, white collar employment in the private sector.
The same weakness is reflected in the low union membership among those earning less than £250 a week: 17.5 percent, compared to 41.9 percent for those earning between £500 and £999 a week.
There is nothing new in the concentration of unions within the sections of the working class that suffer a little less than most – even if it seems strange to those of us who are old enough to remember teachers wearing mortar boards and civil servants bowler hats. Skilled rather than unskilled workers have usually managed to hold their union organisation together through periods of defeat or demoralisation. They have been under less pressure, with more time and energy to devote to union matters.
But there has always been a danger that the more skilled also hold on to “labour aristocrat” attitudes that treat with disdain the mass of semi-skilled and unskilled workers. The danger today is that union activism can be concentrated in areas such as education, the health service, local government or the civil service – cut off from the majority of workers. Sometimes activism is even focused on those who have been drawn into playing a semi-managerial role (union membership among of female managers runs at 37.4 percent, higher than membership for non-managerial or non-supervisory roles).
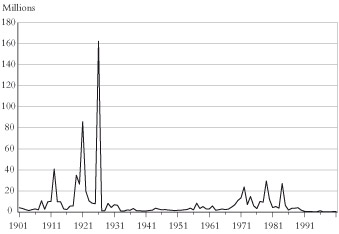
This briefing gives snapshots of a dynamic process. Unions do not simply recruit and hold on to members. There is a continual turnover of members, with new, usually younger, people getting jobs and others, usually older, leaving them. There are also transformations in the structure of employment and of the potentially unionisable workforce with every change in the structure of capitalism – and with each economic crisis (we are now entering the fifth in 35 years). Finally, the very instability and unpredictability of the system leads to sudden changes in the willingness of workers to challenge their bosses and cause union organisation to break through in new sectors of industry. It was such upsurges in militancy that explained the sudden spells of union growth after 1889, 1912, 1919 and the late 1960s. Today, whenever strikes take place, the result is a rush of workers to join unions.
|
Figure 11: Working days lost due to labour disputes, 1901–2001 |
|
It was not, in any of the upsurges in the past, established union leaderships that led to new sectors being organised. Unions are bureaucratic organisations, with career structures for officials that encourage them to prefer certainties of established routines to the risks of struggle, or even to the effort involved in recruiting new union members – with occasional very important exceptions. So upsurges of militant struggle generally preceded the growth of unions. Likewise the defeats, such as those of the general strike in 1926 and of the miners in 1985, precipitated big declines.
The struggles always had a strong spontaneous element. Nevertheless, socialist activists played an important role at each stage of the upsurges – Tom Mann, John Burns, Will Thorne and Eleanor Marx in the late 1880s; the syndicalists (again including Tom Mann) during the Great Unrest of 1912-4; the shop stewards movement during the First World War; and those involved in the rank and file groupings in various unions and industries in the late 1960s and early 1970s.
No one can say with certainty how various sections of the working class in Britain will react to the combination of recession and inflation, which is cutting real living standards of those with jobs for the first time for a generation, alongside deep disillusion with the Labour government.
The long decline in union organisation means many sectors are still suffering the hangover from the defeats of the 1980s and successive waves of restructuring. But the figures presented here show that a large proportion of workers are still committed to the ideals of trade unionism, even in workplaces and sectors where unions barely exist. The possibility of an explosion of anger remains, as shown by big recent votes for industrial action in the public sector and flashes of militancy in the private sector. The job of revolutionary socialists is to try to do something few union officials will – to give direction to the anger, draw in new groups of workers, rebuild organisation and infuse the unions with a different politics to that of the Labour Party.
1. Mercer and Notley, 2008.
2. On the differences, see Mercer and Notley, 2008, p. :47.
3. A breakdown of union density by occupation, as opposed to sector, is given in Mercer and Notley, 2008.
Grainger, Heidi, 2006, Trade Union Membership 2005, Department for Business, Enterprise and Regulationary Reform (National Statistics), www.berr.gov.uk/files/file25737.pdf.
Lindsay, Craig, 2003, A Century of Labour Market Change: 1900 to 2000, Labour Market Trends, volume 111, number 3 (National Statistics), www.statistics.gov.uk/downloads/theme_labour/LMT_March03_revised.pdf.
Mercer, Sally, and Richard Notley, 2008, Trade Union Membership 2007, Department for Business, Enterprise and Regulationary Reform (National Statistics), http://stats.berr.gov.uk/UKSA/tu/tum2008.pdf.
Last updated on 12 December 2019