Graph three: World GDP growth rate 1961–2006 [7]
MIA > Archive > Harman > Zombie Capitalism
“A substantial decline in macroeconomic volatility” was “one of the most striking features of the economic landscape over the past 20 years or so”, declared Ben Bernanke in 2004. [1] Such had long been the view of most mainstream economists and politicians:
New Paradigm advocates received cautious support from the US Treasury Secretary Larry Summers and chairman of the Federal Reserve, Alan Greenspan ... Mr Greenspan said the recent economic performance was “not ephemeral”. [2]
They spoke of the longest continuous period of American economic growth for four decades and the lowest level of unemployment for three. This was supposedly a new, unprecedented period of non-inflationary capitalist expansion, baptised “the great moderation” or “the new economic paradigm”. Stagnation, unemployment and inflation had supposedly been left behind.
For Bernanke, the explanation lay in the greater capacity of the states and central banks to handle the money supply than in the 1970s. For others it lay in the new technologies associated with the microprocessor:
A new economy has emerged from a spurt of invention and innovation, led by the microprocessor ... opening all sectors of the economy to productivity gains ... The new economic paradigm has brought us the best of all worlds – innovative products, new jobs, high profits, soaring stocks. And low inflation. [3]
The advances of what was called “Anglo-Saxon capitalism”, supposedly based on unleashing “economic freedom” and “entrepreneurship”, were contrasted with the laggardly rates of growth in Europe and the stagnation in Japan. In Britain New Labour boasted it was following the US example. “No return to boom and bust” was the refrain in every budget speech of chancellor of the exchequer (and future prime minister) Gordon Brown.
The enthusiasm had received a temporary setback when the Asian crisis of 1997 spread to about 40 percent of the world. The Financial Times had headlines about an “economic meltdown” and “a house of cards”, while the BBC ran a special Newsnight programme, Is Capitalism Collapsing? But the panic did not last for long. Within months the new paradigm was rising high again: both Patrick Minford, former economic adviser to Margaret Thatcher, and Meghnad Desai, former economic adviser to Gordon Brown, insisted in debates late in 1998 that all that had occurred was a passing storm of no significance, and all problems had been solved by quick intervention by the US Federal Reserve. [4] There was brief panic again in the summer of 2001 as the US went into recession. “The world economy is starting to look remarkably, even dangerously, vulnerable”, stated the Economist. “Industrialists and bankers at their annual get together on banks of Lake Como did little to disguise their over-riding pessimism” [5], reported the Financial Times. But again amnesia soon set in and financial commentators were describing the economic panic of a few months earlier as “the recession that was over before it began” [6] – despite, or perhaps because of, the loss of one in six manufacturing jobs in the US. Renewed economic growth in the US led to even greater optimism than before. The International Monetary Fund could declare year after year that the picture for the future was of fast economic growth. So in April 2007 a typical IMF press release about its most recent world survey read, “Global economy on track for continued strong growth.” There were a few mainstream doubters, but their worries were only ever discussed in order to be dismissed.
The overall message was that capitalism was going from strength to strength with supposedly record world growth figures. Even those sceptical about the claims for the advanced countries often accepted a modified version of the optimism when it came to the system as a whole. Hardly a day went past without media references to the “new giants”, China and India, and soon compliments were being poured on the other countries included with them in the new “BRICS” rubric – Brazil, Russia and South Africa. Even if the old industrial states were to run into problems, these new centres of capitalist growth would maintain the stability of the world system. The faults that were recognised in the global system were regarded rather as Stalin’s admirers used to speak of his “occasional errors”, as “spots on the sun”.
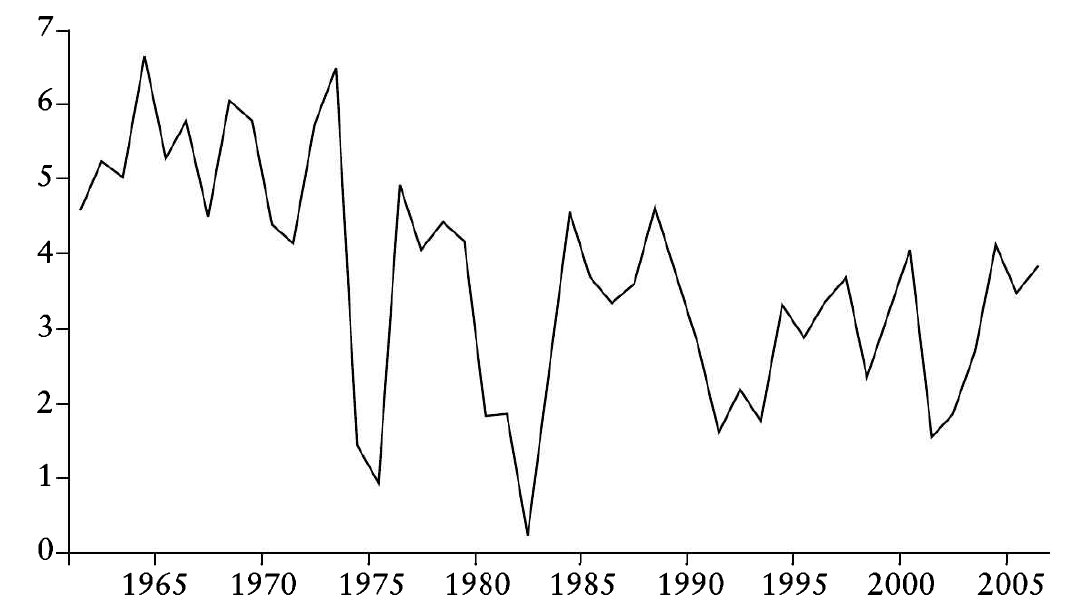
For those commentators prepared to look honestly and go a little deeper than immediate appearances, there were disturbing signs. While the IMF, for instance, was exuberant about prospects, research commissioned by the World Bank painted a rather different picture. Growth for the world as a whole was well down on the levels not only of the long boom, but also of the first decade and a half after its end:
|
Graph three: World GDP growth rate 1961–2006 [7] |
|
|
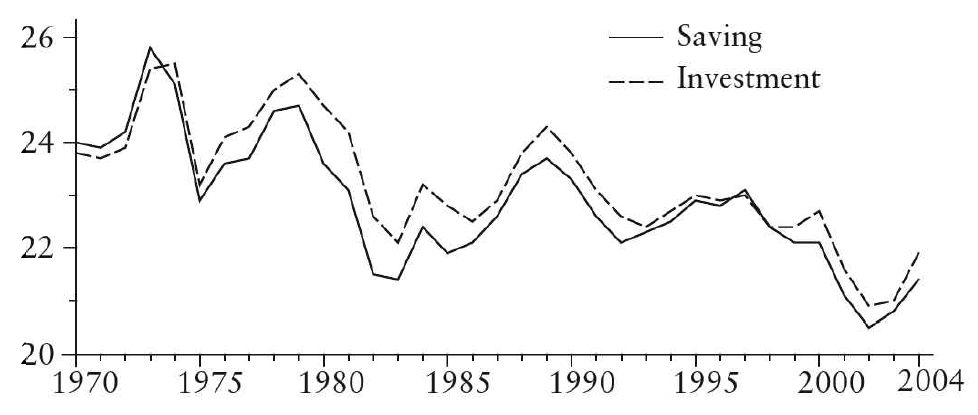
It was only possible to draw a different conclusion, as an IMF graph in the April 2007 World Review seemed to, by starting the series in 1970 – with the beginning of the end of the long boom. [8] Parallel with the decline in growth rates went a long-term slowdown in global investment, as research for the IMF revealed (see graph below).
|
World accumulation [9] |
|
The fall in accumulation and the growth of output took place alongside a continuing low level of the rate of profit compared with the “golden age”. There had been some recovery from the low point of the early 1980s, but only to reach about the level of the early 1970s – the turning point that ended the “golden age”. Calculations for the US suggest that recovery of profitability from the recession of 2001–2 through the years immediately preceding the credit crunch of 2007 again failed to raise it to anything like the level of the long boom. Robert Brenner shows it moving marginally ahead of the early 1970s figure, only then to fall back. David Kotz shows the profit rate in 2005 as 4.6 percent, compared with 6.9 percent in 1997. [10] Fred Moseley shows a bigger recovery of recent profit rates, but his calculations still leave them at their high point (in 2004) as only marginally above their lowest points in the long boom. [11] The overall pattern of the 1990s and the early 2000s was a continuation of that of the 1980s – of a certain recovery of profit rates, but not sufficient to return the system to the long term dynamism of the long boom.
Marx saw restructuring through crisis as enabling capitalism to recoup the rate of profit, and the “Austrian School” of mainstream economics likewise saw crises as the only way to reinvigorate the system. Each crisis in the 1980s, 1990s and early 2000s did lead to widespread restructuring of industry. There were closures of factories, mines and docks in all the world’s industrial heartlands. Industries which had characterised whole regions decamped; others saw their workforces shrink to half or a quarter of their former size, as with the heavy industries of northern China, Detroit’s car plants, the Polish shipyards and the meat refrigeration plants of Greater Buenos Aires.
But the restructuring through crises did not have the full effect it had had in the “free market” period of capitalism from the early 19th century until the First World War. It did not get rid of unprofitable capital on a sufficient scale to raise profit rates to the levels of the 1950s and 1960s. The neoliberal ideology may have embraced the notion of “creative destruction”, with its implication that some giant firms must be allowed to go bust in the interests of the others. But the practice of states – and of the pressures which industry and finance put on states – was rather different. The fear of what the collapse of the really big corporations and banks might do to the rest of the system persisted.
Hardly any big firms had been allowed to go bust during the first two crises of the mid-1970s and early 1980s. Governments had continued to step in to keep them afloat, most notably with the US state’s support for the bail-out of the car giant Chrysler at the end of the 1970s, of the Continental Illinois bank in 1984 and of the Savings & Loans corporations (the US version of building societies) in the late 1980s. Things changed to some degree from the late 1980s onwards. As the Bankruptcy Year Book reports:
During the 1980s and early 1990s record numbers of bankruptcies, of all types, were filed. Many well known companies filed for bankruptcy ... Included were LTV, Eastern Airlines, Texaco, Continental Airlines, Allied Stores, Federated Department Stores, Greyhound, R.H. Macy and Pan Am ... Maxwell Communication and Olympia & York. [12]
The same story was repeated on a bigger scale during the crisis of 2001–2. The collapse of Enron was, as Joseph Stiglitz writes, “the biggest corporate bankruptcy ever – until WorldCom came along”. [13] This was not just a US phenomenon. It was a characteristic of Britain in the early 1990s, as bankruptcies like those of the Maxwell Empire and Olympia & York showed, and, although Britain avoided a full recession in 2001–2, two once dominant companies, Marconi/GEC and Rover, went down, as well as scores of recently established dotcom and hi-tech companies. The same phenomenon was beginning to be visible in continental Europe, with an added twist in Germany that most of the big enterprises of the former East Germany went bust or were sold off at bargain basement prices to West German firms [14], and then in Asia with the crisis of 1997–8. On top of this there was the bankruptcy of whole states – notably the USSR, with a GDP that was at one stage a third or even half that of the US.
However, governments had certainly not completely given up intervening to limit the impact of crises on large capitals, nor had the most important capitalist sectors stopped demanding such intervention. This was shown by the way the US Federal Reserves stepped in to save the Long Term Capital Management hedge fund in 1998. A worldwide sample of “40 banking crisis episodes” in 2003 found that governments had spent “on average 13 percent of national GDP to clean up the financial system”. [15] Governments as varied as those of Scandinavia and Japan had rushed to prop up banks whose collapse might damage the rest of the national financial system – even if this involved nationalisation as a last resort. [16] Governments took the costs of writing off losses away from particular individual capitals. But those costs had then to be covered from elsewhere in the system – either by taxation, hitting the real wages of workers or the profits of capital, or by borrowing which eventually had to be repaid somehow from the same sources. The benefits for those capitals which survived the crisis were limited as a result. The rising rate of bankruptcies only partially relieved the pressure on their profit rates.
Further relief came from a slower rise in investment compared to productive labour power (Marx’s organic composition of capital). The slowdown in accumulation due to lower profitability played a role in this. So did continued waste expenditure, particularly military expenditure. This absorbed a considerably lower level of world output than in the 1950s and 1960s, let alone than during the Second World War. But it still absorbed a much higher amount than in the pre-1939 world. And there had been an increase in US military expenditure during the “Second Cold War” of the 1980s under Ronald Reagan, and again with the “war on terror” under Bush in the early and mid-2000s – and since US military expenditure was half the global total, this meant an overall increase across the system. One estimate is that by 2005 US military spending had risen to a figure equal to about 42 percent of gross non-residential private investment [17] – a big drain on resources that could otherwise have gone into accumulation. At the same time, unproductive expenditures in the financial sector soared, as we shall see later.
The effect of all of these forms of “waste” was much less beneficial to the system as a whole than half a century earlier. They could still reduce the downward pressures on the rate of profit from a rising organic composition of capital – it certainly does not rise as rapidly as it would have done if all surplus value had gone into accumulation: “The rate of growth of the capital/labour ratio fell in most countries” in the 1990s. [18] But the old industrial capitalist countries paid the price for a continued slowdown in productive accumulation and long-term growth rates.
|
Changes in profit rates of six decades [19] |
||||||
|
|
|
Manufacturing |
|
Non-farm/ |
|
Non-financial |
|
1948–59 |
0.250 |
0.110 |
0.143 |
|||
|
1959–69 |
0.246 |
0.118 |
0.150 |
|||
|
1969–73 |
0.166 |
0.109 |
0.108 |
|||
|
1969–79 |
0.135 |
0.107 |
0.103 |
|||
|
1979–90 |
0.130 |
0.094 |
0.090 |
|||
|
1990–2000 |
0.177 |
0.107 |
0.101 |
|||
|
2000–2005 |
0.144 |
|
0.091 |
|||
|
Evolution of capital intensity and capital stock [20] |
||||||||
|
|
1980–90 |
|
1990–98 |
|
1995–98 |
||
|
United States |
|
Capital stock |
3.0 |
2.6 |
3.3 |
|||
|
|
Capital/labour ratio |
1.1 |
0.6 |
1.0 |
||||
|
Japan |
Capital stock |
5.7 |
4.2 |
3.6 |
||||
|
|
Capital/labour ratio |
4.9 |
4.7 |
4.4 |
||||
|
Germany |
Capital stock |
2.6 |
2.6 |
2.3 |
||||
|
|
Capital/labour ratio |
2.9 |
3.7 |
3.1 |
||||
|
France |
Capital stock |
2.0 |
2.0 |
2.0 |
||||
|
|
Capital/labour ratio |
2.3 |
2.3 |
2.3 |
||||
|
Italy |
Capital stock |
2.8 |
2.7 |
2.7 |
||||
|
|
Capital/labour ratio |
2.7 |
3.5 |
3.4 |
||||
United Kingdom |
Capital stock |
1.8 |
1.6 |
1.6 |
||||
|
|
Capital/labour ratio |
1.8 |
1.2 |
1.0 |
||||
Two other factors can have some impact on the level of investment capitalists have to undertake to remain competitive. There is the increase in the speed at which capital produces and sells commodities (what Marx called the “turnover time” of capital) as a result of advances in transport technology and of the computerisation of warehousing and stock keeping (what are often called today “logistics”). An estimate is that “capital services” grew 2 to 3 percent faster than the capital stock in the late 1980s and 1990s for most countries. [21] This would have reduced the costs to capitals of holding stocks of raw materials on the one hand and of goods awaiting sale (their “circulating capital”). But the second factor will have worked from the opposite direction – the reduced lifetime fixed capital had before it became outdated (what is known as “moral” depreciation). Computers and software become obsolescent because of technical advances much more quickly than other capital equipment – in perhaps two or three years rather than ten, 20 or even 30 – and the increased depreciation costs cut into profits. [22]
This was ignored by the argument of the late 1990s and early 2000s that the increase in productivity due to massive growth of cheap computing power was the basis of a new era of continuous growth. As we saw in Chapter Three, the more rapidly firms have to replace their fixed capital, the more it cuts into any increase in profits they got from installing it in the first place. What is more, once a new technology has spread beyond the firms that first introduce it, its effect is to reduce the value of each unit of output: the late 1990s and the early 2000s were a period in which the prices of goods produced by the new technology tumbled, leading to increased competitive pressure on all the firms in these industries. A wave of innovation could no more create an endless boom in the late 1990s and early 2000s than it could in the “new era” of the 1920s.
The most important factor in reviving profit rates was not computerisation, or the reorganisation of capital as such, but the increased pressure capital was able to put on those who worked for it as successive waves of restructuring disrupted old patterns of working class resistance. Capitals took advantage of the redundancies and dislocations caused by restructuring to put relentless pressure on workers to work harder while wages were held down.
|
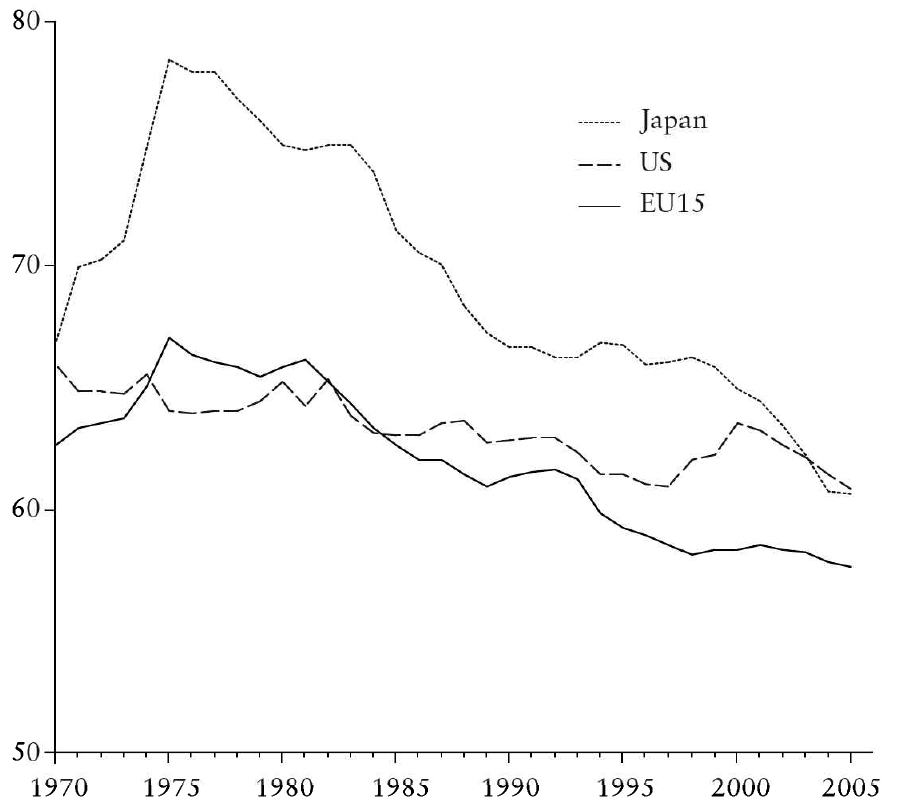
OECD Employment Outlook 2007, p. 117 [23] |
|
There was a decrease in the share of national income going to labour in all of the major Western economies. In the United States, “productivity grew 46.5 percent between 1973 and 1998”, while the median wage fell by about 8 percent [24] and that for production workers by 20 percent [25] (with workers only able to protect their living standards by an increase in average working hours from 1,883 hours in 1980 to 1,966 in 1997 [26]). Western Europe did not see the same increase in hours (apart from in Britain, where unpaid overtime soared) or a reduction in real wages as in the US in the 1980s and 1990s, but governments and firms began to push for both in the new millennium. “Real wages have fallen dramatically and working hours are nearly back to 40 a week”, reported the BBC on Germany in 2005. [27]
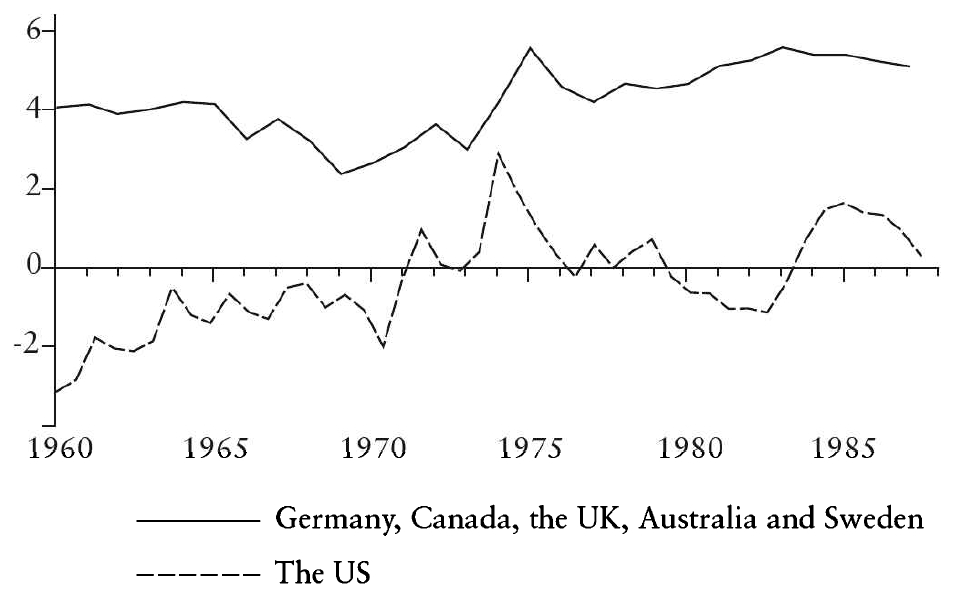
It was not only wages and working conditions that had to be put under pressure. So too did the various services provided by the state (and in some case by private firms) that make up the “social wage”: healthcare, pensions, education. During the long boom these had been, as we have seen in Chapter Seven, by and large, paid for out of the taxes on the working class, as is shown by figures by Anwar Shaikh for what he calls “the net social wage” – the difference between what workers pay in and what they get out (see Graph A below). [28] But the impact of recurrent crises, rising unemployment and an ageing population had been to push welfare expenditures upwards (Table B), until even in the US the cost could no longer always be covered by the taxation on workers and therefore tended to hit capital. The figures show enormous unevenness between the degree to which different states – and firms operating in those states – were hit by both the overall level of the “net social wage” and the rise in the welfare expenditures in the 1970s and 1980s. They responded by a series of “reforms” (in reality counter-reforms) which, under the label of “modernisation”, aimed at reversing this trend.
|
Net social wage as percent of GDP |
|
|
Welfare expenditure as percent of GDP 1979 and 1995 [29] |
||
|
Country |
1979 |
1995 |
|
Australia |
13.2 |
16.1 |
|
Canada |
14.5 |
18.0 |
|
France |
22.0 |
29.1 |
|
Germany |
25.4 |
28.7 |
|
Italy |
21.2 |
22.8 |
|
Sweden |
25.1 |
34.0 |
|
United Kingdom |
16.4 |
22.5 |
|
United States |
13.8 |
15.8 |
Each success any one government had in doing this put pressure on other governments to do likewise. But real wages could not be cut, working hours prolonged, or welfare benefits curtailed without causing popular resentment with the potential to explode into all out resistance. The level of resistance varied from country to country, depending on established levels of working class organisation and the outcome of key attacks on it (like the defeat of the long 1980s strikes of air traffic controllers in the US and of miners and print workers in Britain). The most visible result was that the proportion of national output going to welfare in the mid-1990s in France and Germany was about 14 percent higher than in the US and over 6 percent higher than in Britain. The same contrast between the success of the capitalist offensive in the US and Britain and its effects in Europe was shown by the figures for working hours. In these trends lay the supposed advantage of the “Anglo-Saxon” model over the European model for the capitals based within each.
European capital found itself facing problems it had not faced in the years of the boom or even in the decade and a half after it collapsed. Output per head in what is now the Eurozone had grown from 40 percent of the US figure in 1950 to 75 percent in 1975, and German growth, like that of Japan, exceeded that of the US in the 1980s. In 1990 German unification was expected to provide a further massive boost. The mood by the beginning of the new millennium was very different. Overall productivity levels had long since stopped catching up with the US. Those challenging the US auto industry on its home ground were Japanese transplant plants, not Volkswagen and Fiat. Japan may have lost out to the US in computers, but at least it had a computer industry while Europe did not. And coming up on the outside in the inter-capitalist race was China. “Europe needs to wake up” was the message pumped out by scores of Euro think tanks, endorsed by centre-left and centre-right politicians alike and inscribed in the Lisbon Declaration of European leaders in 2002.
The picture for European capitalism was not as dire as that message sometimes made out. Germany, not China, was still the world’s biggest exporter in 2006 and its manufacturing industry’s output had grown rapidly, even if its employment had not. The EADS airbus consortium was able to compete with Boeing in a way that the Japanese aerospace industry could not. Spanish and French firms had gobbled up many of Latin America’s banks, and the European Union sold and invested slightly more in the Mercosur region of that continent than did the US. And for the moment Chinese imports only amounted to 1 percent of European GDP.
|
Annual hours worked per worker, |
|
|
Koreans |
2,380 |
|
Mexicans |
1,848 |
|
Americans |
1,824 |
|
British |
1,689 |
|
French |
1,441 |
|
Dutch |
1,357 |
There were, nevertheless, reasons for European-based capitalism to worry and to nag states to take action on its behalf. French and German based capitals faced the dilemma that although they were more productive in output per hour worked than capital based in the US [31] they lost out in terms of overall productivity because of the few hours they got from each worker in a year.
European capital therefore found itself under pressure from at least three sides in global markets – from the US and Japan in high technology products and from China in lower technology products. Its response was to push for copying the US approach of imposing “flexible labour markets” so as to get longer working hours and more intensive production (in Marx’s terms absolute and relative surplus value) and to try to cut back on welfare expenditure. This was the rationale behind “neoliberal” policies, with counter-reforms of welfare and the use of marketisation and privatisation measures to get workers competing with each other.
German capital followed a policy through the Bundesbank (and then the European Central Bank) in the 1990s of sacrificing economic growth to hold down wages (which rose cumulatively 10 percent less than the European average) and so increasing exports and the share of profits. The paradoxical outcome was that Germany had a big trade surplus and good profits, but a reduced share of world investment and production. This lay behind the pressure it applied successfully in the early 2000s to getting the then Social Democrat-Green government to push through counter-reforms in the Agenda 2010 Programme. Its main planks were a drastic reduction of unemployment benefits by a third, denying any benefits at all to 800,000 people, forcing the unemployed to accept jobs with below average pay, freezing pensions and charging for visits to doctors. Meanwhile, big firms threatened to move production to low wage sites in Eastern Europe if workers did not accept increased working hours. Such “internal modernisation”, said Chancellor Schroeder, was “the prerequisite for Germany’s assertion into global politics”. [32] The overall result was that German real wages fell for the first time in half a century. The same logic lay behind the attempts of French governments to cut back on public sector pensions, to reduce the rights of young workers and to do away with the 35 hour week.
But this was an economic strategy that raised big political problems. For half a century after the Second World War capital and the state sought to legitimise themselves through the ideology of national consensus while collaborating to various degrees with the trade union bureaucracy. This applied not only to social democracy in Germany and France, but also to the Christian Democrat and Gaullist variants of conservative politics. There had seemed no reason to disturb society by overturning this approach so long as their economies seemed to be advancing in comparison with their major competitors. Now the attempt to attack the reforms granted in the past threatened to tear apart the old ideological hegemonies, driving workers whose social democratic attitudes took for granted “partnership” with capital into an antagonistic relationship to it. Capitalists and states were caught between their economic priorities and maintaining their ideological hold on the mass of people.
Of course, there was also in operation a second option for them – that of physically moving production overseas. But this takes time with most sorts of industrial production (fully equipped factories are rarely easy to move, and even when they are there is then the question of energy supplies, transport facilities, a secure political environment, and so on). So it was that even in Britain 30 years of restructuring and factory closures, with a halving of the workforce, did not permanently cut overall manufacturing output. [33]
Even when they considered moving production in the long term, the giant European firms still depended in the interim on finding some way to increase the exploitation of their local workforces. In practice few firms envisaged, for the moment, moving all their production abroad (although the German car industry increasingly used cheap labour in Eastern Europe to solve some of its problems) and this made the need to raise the exploitation of the domestic workforce paramount.
When people like Samuel Brittan wrote of the future for capitalism lying in Asia in the early 1990s they meant the small newly industrialising countries of the region – the “tigers” of South Korea, Singapore, Hong Kong and Taiwan, and the “tiger cubs” of Malaysia, Thailand and Indonesia. These had experienced very rapid rates of economic growth, leading the OECD to write of a South Korean “economic miracle” in 1996. By this time Korean living standards approximated to those of the poorer Western European countries; some of the country’s firms established themselves as global giants. Posco, the world’s third largest steel producer, boasted that its Kwangyang steel complex, opened in 1992, was “the most modern in the world”. [34] But much of the growth depended on each tiger holding wages down to compete with the others for Western markets. It was a classic case of blind competition between rival capitals (or in this case state monopoly capitals) and eventually led to output that was too great for the existing market to absorb. By June 1997 there was only 70 percent capacity utilisation in Korea and 72 percent in Taiwan [35], and all the countries depended on foreign borrowing to finance trade deficits. Yet when financiers suddenly reacted by withdrawing funds from Thailand, forcing the devaluation of its currency, those enamoured of the “miracle” tried at first to think nothing serious was happening. The Thai crisis, wrote Martin Wolf in the Financial Times, was “nothing more than a blip on the path of rapid East Asian growth”. Within weeks the crisis had spread to all the tigers and tiger cubs, causing economic contraction, reliance on IMF austerity packages, the sudden impoverishment of millions of people and growth rates in the 2000s much slower than in the 1980s and 1990s. But this did not shatter the faith in many quarters that capitalism in East Asia could see off any problems that might be encountered in the West. Communist China became the new bearer of their hopes.
Certainly the emergence of China as an economic power was one of the most important developments within the world system at the beginning of the 21st century. The scale of Chinese economic advance was awesome. Its average growth rate for the period 1978 to 2008 was about 8 percent a year; its economic output was about nine times greater at the end of the period than at the beginning; its share of world trade had risen from less than 1 percent in 1979 to over 6 percent in 2007, until it was just behind Germany, the world’s biggest single exporter; by 2005 it was “the leading producer in terms of output in more than 100 kinds of manufactured goods”, including 50 percent of cameras, 30 percent of air conditioners and televisions, 25 percent of washing machines and 20 percent of refrigerators. [36] Chinese cities like Beijing, Shanghai, Guangzhou or even Xian in the interior no longer bore much resemblance to Third World stereotypes. The forests of skyscrapers in Beijing or Shanghai made London’s much vaunted Docklands development look like Toytown, while the vast industrial developments around Shanghai had few comparisons in Western Europe. Dramatic changes were taking place in what was previously assumed to be a “backward” country of limited economic significance to the world system.
China, like most other industrialising Third World countries, had suffered a crisis just as the long boom was coming to an end in the West. A quarter of a century of what Marx had called primitive accumulation had transformed tens of millions of peasants into wage workers and built up some of the bases of modern industry – but this industry was no match in terms of efficiency for that in many other parts of the world system. The sheer scale of exploitation of the mass of the population led to all sorts of pressures building up from below, while the inability to keep up the pace of industrialisation led to repeated crises within the ruling group. These culminated in massive political upheavals in the years 1966–75 (from the “Cultural Revolution” to the rise and fall of the “Gang of Four”) which were only finally resolved after Mao Zedong’s death in 1976.
The resolution of the crisis consisted of ad hoc moves to a new structure of accumulation. A series of reforms pushed through in 1978–81 began with relief for peasants through a raising of the purchasing price paid by the state for their produce. The peasants were now free to decide how to use some of the surplus left after (just about) feeding themselves. There was a huge rise in agricultural production, and the increased incomes provided a market for some of the under-utilised industrial capacity. A loosening of state controls allowed it to satisfy this demand, and overall output soared ahead.
Increasing social differentiation within the peasantry led some to accumulate a surplus and then to use the new freedoms from state control to invest in establishing locally based “village industries”. Formally owned by village governments, in practice these provided a means of self-enrichment by those with connections to the local party apparatus. A new market capitalism grew up in the south east of the country alongside the old state capitalism centred mainly in the north, and the regime allowed the new industries to link up with overseas Chinese capitalist interests in Hong Kong and elsewhere.
The surplus passing from the peasantry into the hands of three groups of capitalists (state, “village” and overseas) was still massive despite the reforms, while low peasant incomes meant a ready supply of workers for the new industries, which did not even have to provide the guaranteed minimum living standards and social protection (the so-called “iron rice bowl”) of the old state-run heavy industries. In effect, there was a new model of capitalist accumulation, combining the high level of exploitation and repression of the old state capitalism with a turn towards catering for markets – and the markets came increasingly from exporting to the rest of the world system, while providing for the increasingly conspicuous consumption of the old state bureaucracy on the one hand and its children as they took over privatised industries on the other.
The new hybrid economy had contradictions of its own, with the ups and downs of market capitalism superimposed on the ups and downs of the old state capitalist accumulation model. There were wild fluctuations in growth rates. The scale on which the new industries competed with each other for resources created shortages and forced prices up, until the state tried to impose some order on the market by curtailing funds for further investment. So the growth rate could be above 20 percent in 1984, down to around 3 percent in 1985 and back up to close to 20 percent in 1988. There then followed a major economic, social and political crisis in 1989 as growth fell right back and prices soared. This was the economic background to tumultuous student and worker demonstrations in 1989 in most of the major cities, most famously in Tiananmen Square in Beijing.
The regime found a way out of the crisis from 1992 onwards almost by accident. Unable to control things itself, it placed its hopes on unleashing a new round of accumulation based on uncontrolled competition between different industrial concerns. Those who ran village governments were able to turn the new industries into their private property and link up with foreign capital, as were the managers of the great state-owned enterprises. There was a massive rationalisation of old industries, with perhaps 30 million workers losing their jobs. These measures were acclaimed as “progressive” by pro-capitalist economists right across the world. What they meant for workers was portrayed graphically in the 2003 Chinese film Blind Shaft, in which the degrading conditions under which the miners work lead two of them to murder a co-worker in an attempt to blackmail corrupt managers. The closeness of reality to the fiction was shown in a mining disaster in Guangdong (supposedly China’s most “advanced” province) in the summer of 2005. As more than 100 miners suffocated underground, the owner fled when it was revealed he had paid out millions of dollars in bribes to take over the previously shut down state-owned mine, and at the same time to buy himself a senior position in the local police force. In this way he had been able to ignore all safety precautions while parading himself as an exemplary “entrepreneur” for his role in supplying coal to satisfy the energy needs of a booming economy. [37]
Alongside the attack on the old working class was a renewed upping of the level of exploitation of the rural workforce, who still made up two thirds of the total. One (banned) Chinese study told of a fall of 6 percent in peasants’ per capita farming incomes after 1997, and “given the rising costs of health and education, their real purchasing power has probably fallen still further”. [38] But the average does not tell the whole story. Class differentiation within the peasantry involved local officials using their powers to grab money (in the form of local taxes) and land off other peasants with the aim of enriching themselves as petty agrarian capitalists – the cause of many local near-uprisings.
Enthusiasts for capitalism claimed the turn to the market had led to an unprecedented lifting of hundreds of millions of people out of poverty. And the abandoning of the crude methods of primitive accumulation in the mid-1970s had permitted much of the industry built up through its methods to be used more productively, with the result that not only the new rural capitalists but also those from peasant families who moved to work in the cities could enjoy improved living standards. But for the great majority of the population, they were still low living standards. The World Bank admitted in the early 2000s that 204 million people, or one in six of the population, still lived on less than $1 a day. Other estimates suggested that “the vast majority of the 800 million peasants” had incomes at this level. [39]
The key to China’s rapid growth rates was an unparalleled level of accumulation. The proportion of national output going into investment rose to 50 percent in 2006 [40]:
In recent years, no OECD or emerging market economy had a ratio greater than 30 percent (averaging over three years to smooth out cyclical effects) ... Even compared to Korea and Japan during their boom years, the ratio in China today looks high. [41]
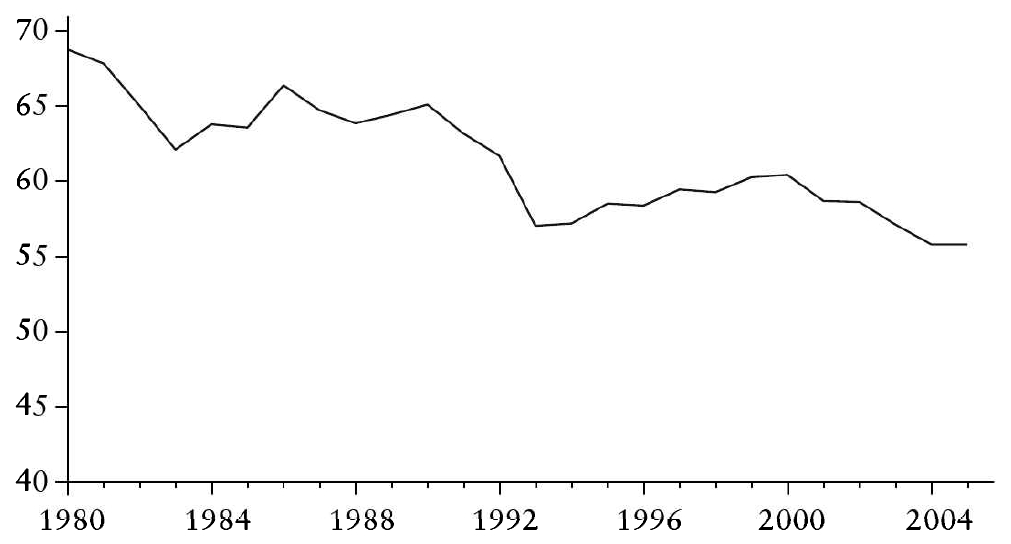
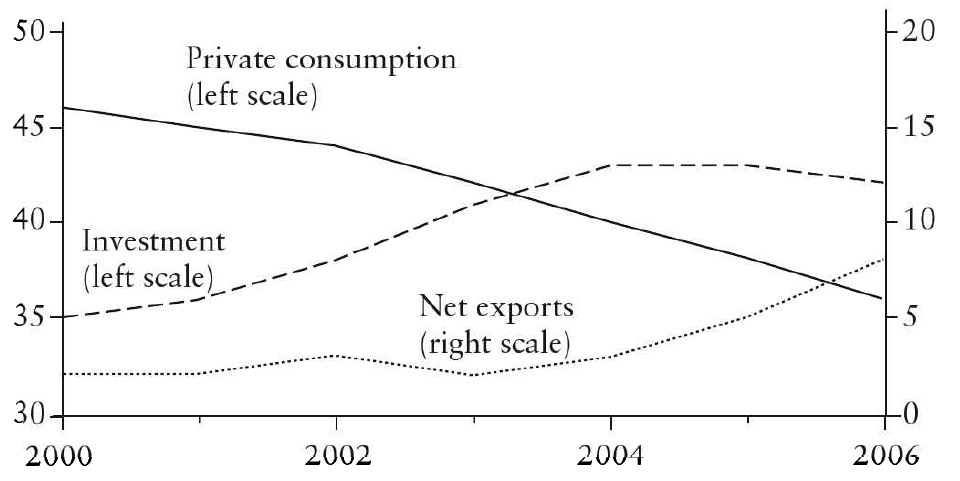
The rising investment was paid for out of total savings in the economy also rising to over 50 percent of output. Some of the saving was by workers and peasants, who needed it in order to pay for emergencies like medical care and for their old age. Effectively, they handed over a portion of their incomes to state-run banks which have then loaned it to state and privately owned enterprises. But in the early and mid-2000s an increasing proportion of saving came out of the profits made by companies, which rose by about 5 percent of GNP in the early 2000s [42], This was possible because household consumption as a share of output fell sharply, to only about 40 percent [43], with the share of wage income falling from 67 percent in the 1970s to around 56 percent in 2005 (see graph). [44]
|
The decline in wage share did not necessarily mean a decline in real wages, since it was a declining share of rising output. What it did mean, however, was that China’s economy exemplified Marx’s picture of accumulation taking place for the sake of accumulation. The picture was even starker if the section of the economy devoted to exports was taken into account. By the turn of the millennium 80 percent of new growth each year was going to investment and exports as opposed to satisfying the needs of China’s people, and, in a further twist, by 2007 nearly 10 percent of China’s income took the form of a surplus of exports over imports that was then deposited in the United States – effectively used to finance government or private American consumption (graph [45]), which then provided an outlet for further Chinese exports.
|
Accumulation at such a rate created three sets of problems, all of which Marx had been familiar with. First it draws in resources on a massive scale, creating shortages that push prices up. The impact of Chinese growth in the early and mid-2000s was to absorb raw materials and foodstuffs from across the world, raising their prices internationally (and in the process giving an economic boost to raw material producers in places like Latin America) – and eventually the rising prices fed back into China.
Second, it leads to a growth of output that cannot be absorbed by a national economy in which wages constitute a diminishing share of output, except by still more accumulation – or by ever greater stress by firms on exports.
But there is enormous competition in export markets – not just from enterprises abroad, but with other enterprises operating in China. The increasing pattern has been one of Chinese factories assembling components produced elsewhere in East and South East Asia, with the final output then being exported. This ties Chinese based exporting firms into competing multinational supply lines: “The percentage of exports produced by foreign-based corporations grew from 17.4 percent in 1990 to 50.8 percent in 2001.” [46] By the early 2000s the result of such competition was a level of output that could not always be absorbed completely by the world market any more than by the domestic market. The National Statistics Bureau reported that “of all Chinese manufactured products, 90 percent are in oversupply” [47], despite massive price cutting: “Among Chinese companies the price war is particularly intense because competitors often chase market share rather than trying to increase short term profitability,” a Financial Times correspondent could report: “Relentless competition among local suppliers keeps profit margins almost invisible for many firms.” [48]
It was not only the output of export-directed consumer goods that tended to get out of hand. “Investment in many sectors – including property, cement, steel, cars and aluminum” was “being overdone”, Chinese government officials complained. [49] In a system constructed around the goal of accumulation for the sake of accumulation and then left to run itself, top managers measured their success by the speed at which their firms grew – and the government-run banks then rewarded those that grew fastest by allowing them to accumulate debts. [50]
A third problem, which exacerbated the previous two, was that the ratio of investment to workers employed – and to output – was rising, despite the abundance of labour. While investment was increasing by about 20 percent a year, employment growth throughout the economy as a whole was only about 1 percent – and even in urban areas it was only about 3.5 percent. Total manufacturing employment fell from 98 million in 1997 to 83.1 million in 2001 [51], despite the massive rate of accumulation. The fall was due to large-scale redundancies in the old state-owned heavy industries, but it was not compensated for by the increased employment in the newer manufacturing enterprises – and employment in the “secondary sector” [52] as a whole remained more or less static at round 157 million. In other words, the organic composition of capital rose. Researchers for the IMF reported, “The increase in investment” from the mid-1990s to the mid-2000s had led to “a rise in the capital output ratio and a fall in the marginal product of capital”. [53]
The effect was bound to be downward pressure on profitability. Phillip O’Hara calculates the rate for the economy as a whole as declining from 47 percent in 1978 to 32 percent in 2000. [54] Jesus Felipe, Editha Lavina and Emma Xiaoqin Fan point to the same trend, but with different absolute figures, from 13.5 percent in the 1980s to 8.5 percent in 2003. They quote results from Lardy and from Lin which show the same trend – with some of Lin’s figures showing very small profit rates indeed for some industries (0.2 percent for bicycles, −0.3 percent for buses, 2.9 percent for washing machines, 2.5 percent for beer). [55] A Chinese study by Zhang Yu and Zhao Feng seems to contradict these conclusions, showing the overall rate for manufacturing as falling continually for the 20 years up to 1999, but rising considerably after that. [56] The discrepancy could be explained by the way the massive onslaught on jobs in the state enterprise sector cut into its operating costs. The great counteracting factor preventing a catastrophic fall in profit rates was the continual fall in the share of output going to wages. But this necessarily prevented domestic consumption from absorbing the growing industrial output, further increasing the dependence of accumulation on further accumulation and on exports.
At the same time, there was considerable evidence that the willingness of the banks to lend to enterprises at low rates of interest compensated for the low profit rates of many enterprises – and that parallel with this went a willingness not to push loss-making enterprises into bankruptcy, so loading the banking system with vast, probably unrepayable debts. [57]
As with any capitalist boom, there was a burgeoning of all sorts of speculation as enterprises and rich individuals sought to find quick and apparently effortless sources of profitability: “Investment in real estate grew by almost 20 percent a year over the past four years [to 2005] and reached 11 percent of GDP in 2005.” [58] Everywhere in China’s major cities there was apparently endless building and rebuilding of luxury apartment blocks, relatively expensive (by Chinese standards) fast food outlets, high class hotels, and shopping malls dedicated to selling designer products (even though such stores often seemed virtually empty of shoppers). And there was the lure of international speculation to add to the lure of local profiteering. In March 2008 executives of the CITIC Group in Beijing were on the verge of signing a deal to buy a one billion dollar stake in the US bank Bear Stearns when news came through that it had gone bust. [59]
This combination of contradictions meant that a smooth upward path of growth was a most unlikely scenario for Chinese capitalism. Certainly those charged with managing its economy were by no means confident that they could control the tempo of competitive accumulation in a way that could avoid unexpected catastrophes as managers of enterprises, both private and state owned, sought to outdo each other. Or, as Premier Wen Jiabao told the National People’s Congress in March 2007, “the biggest problem with China’s economy is that the growth is unstable, unbalanced, uncoordinated, and unsustainable”. [60]
The unpredictability of the Chinese economy had important implications for the rest of the world. It had replaced the US as Japan’s biggest export market, while it was in turn the second biggest exporter to the US (just behind Canada and just ahead of Mexico). [61] Its role in importing components from elsewhere in East and South East Asia and raw material from Latin America and Africa made it central to all their economies. And, most importantly, the huge receipts from its trade – much of it with the US – were deposited in the US. Along with the similar surpluses made by Japan and the oil states, it provided the lending which enabled US consumers and the US government to keep borrowing until the “credit crunch” of the summer of 2007. Effectively it lent money to the US (and to a lesser extent to certain European states like Britain) to buy goods it itself made. This added to the appearance of stability of the world system.
Yet those who believed Chinese growth could pull the world system forward if something went wrong in the US and Europe not only forgot that the unbridled markets unleashed in China could not lead to stable as opposed to wildly fluctuating growth. They also failed to take into account the relatively small weight China still had in the world system. In terms of current exchange rates, GDP in 2006 was $2,600 billion – just behind Germany, just ahead of the UK and less than a fifth of that of either the US or the European Union. “Purchasing Power Parity” estimates (based on the buying power of incomes in the domestic currency, the yuan) seemed much higher, at about 50 percent of US or EU GNP according a revised World Bank estimate in 2007. [62] The exchange rate figures considerably underestimate the level of resources available for consumption by China’s population (since domestic prices of basic foodstuffs like rice and basic services like urban transport fares cost a quarter or less of those in the West). But, it is the exchange rate measurement that is important in determining the degree to which a country can import and so provide a locomotive to pull the rest of the world economy forwards. And it was a grave mistake to believe that China, accounting for 4 or 5 percent of global buying power, could somehow compensate for the effect of a major economic crisis in much of the rest of the world system.
The Chinese economy was not yet big enough for it to be an alternative motor for the world system as a whole. But it was big enough for its rapid growth to add to the instability of the global system, as was shown by the way it added to escalating global inflation in the years up to the summer of 2008.
It became commonplace to bracket India with China as the “emerging giants” by the mid-2000s. They had more or less equal populations (around 1,300 million), both were nuclear powers and both suffered deep rural poverty. But India’s real importance in the world economy was much less than China’s. It was about a third of the size in exchange rate terms (considerably smaller in fact than Britain or France) and 60 percent smaller in PPP terms; its growth rates were only a little above 60 percent of that of China in the late 1990s, rising briefly to just less than 90 percent in the mid-2000s; its share of total world exports in 2003 was only 0.7 percent, putting it in 31st position. [63]
There were some parallels with the Chinese pattern: an early attempt at state-directed industrialisation (the period of so-called “Neruvian socialism”) was followed by a few years of stagnation in the mid and late 1970s; and then the introduction of reforms aimed at a much more market based model of accumulation. But there were significant differences. Lacking the crude power of the Chinese state, India’s state and private capitalists were not nearly as successful in subduing other classes (on the one side the old landowning class, on the other the workers and peasants) and so achieved less in the period of state-led primitive accumulation when the Indian growth rate was probably three quarters of China’s. They were therefore less able to benefit from a turn to the world market – exporting less and remaining much less attractive to foreign capital than their Chinese competitors. “Reforms” pushed up the rate of accumulation, with investment reaching 25 to 30 percent of GNP. But this could only be sustained on the basis of a growing portion of output accruing to the capitalist class and the upper middle class, at the expense of the workers, peasants and the poor.
As a 2007 report for the IMF showed:
In the 1990s, the top of the population enjoyed a substantially larger share of the gains from economic growth compared to the previous decade. This had significant effects on income inequality, which grew within states, across states, and between rural and urban areas. [64]
An analysis of income tax data suggests up to 40 percent of growth ended up in the hands of the top 1 percent of the population. [65]
Apologists for capitalism tend to assume rising growth must automatically lead to falling poverty and quote various official statistics showing a decline in the proportion of people living in absolute poverty by 10 percent in the 1990s. But in the same decade there was a fall in food consumption per head in the rural areas, where two thirds of Indians live. Abhijit Sen, re-analysing the official figures, concluded that the total number living in poverty probably grew in the 1990s, that the proportion below the poverty line only fell very slightly, and this was a “lost decade” in terms of fighting poverty. [66] The number below the poverty line in 2002 was 35 percent of the Indian population, some 364 million people. But even this underestimated the degree of suffering. Half of all Indian children are clinically undernourished and almost 40 percent of all Indian adults suffer chronic energy deficiency. [67] Even in the supposedly prosperous states of Gujarat, Karnataka, Kerala, Maharashtra and Tamil Nadu, “more than 70 percent of the rural population consumed less than 2,200 calories per day”. [68]
India’s insertion into the world system means that industrial investment, like that in China, has been overwhelmingly capital- intensive, with the capital output rising substantially in the 1990s. Employment growth was stuck at about 1 percent a year; 0.87 percent in the “organised” (i.e. formal) manufacturing sector [69], even if growth was a little faster in the “unorganised” informal sector where average firm size is less than two people. [70] Most of the people flooding from the countryside to the cities have ended up trying to make a livelihood in the service sector, doing unskilled labour at very low levels of productivity in return for the 50 rupees ($1) a day needed to just about keep a family alive – sweeping and cleaning, working as domestic servants, washing clothes, pushing barrows, peddling cycle rickshaws, hawking goods, portering, waitering, guarding. The much publicised call centres employed only 400,000 people or 0.008 percent of the country’s workforce in 2006. [71]
India’s growth, like China’s, means that by the mid-2000s it represented a much bigger portion of world capitalism than 50 or even 20 years earlier, and this had important implications for the system as a whole. But it was still quite small by the standards of the US or even Japan, Germany and China. This could change if the rates of growth of the mid-2000s were sustained for another two decades: in dollar terms the Indian economy would end up being bigger than the UK. But the most modern centres of industrial society in Mumbai, Hyderabad or Bangalore would still be separated by stretches of rural poverty bigger than most European countries. And long before that the whole process of rapid growth could be thrown off balance both by internal factors and by the impact of instability internationally.
We have seen what happened to the “tigers” in the late 1990s, and before that to the Brazilian “miracle” of the 1960s and 1970s. There was therefore a lot of amnesia involved when people lumped together a very disparate collection of countries, Brazil, Russia, India, China and South Africa (the “BRICS”), and claimed that somehow together they represented an alternative driver for the world system. In fact, renewed economic growth in Brazil, Russia and South Africa depended typically on an upsurge of raw material and agricultural prices in a boom which was bound to come to an end eventually – and when it did so it would hit them seriously.
The great minds that extolled the system paid no greater attention to these contradictions in their rosy picture of Asia than they did to the underlying problems in Europe and North America. Japan had problems, they usually recognised, but this was because of the lack of wisdom displayed by a government which had never really absorbed the lessons about how a free market should operate. As late as the autumn of 2007 financial journalists, government ministers and the stars of academic economics were all agreed that capitalism had found a new long-term stability – and even some Marxists spoke of a “new long upturn”. They were soon to look as foolish as those who forecast endless peace in the early summer of 1914.
1. Ben Bernanke, Speech to the Eastern Economic Association, Washington DC, February 20, 2004, available at http://www.federalreserve.gov.
2. Philip Thornton, The Independent, 1 November 1999.
3. Précis in the US government publication, Monthly Labor Review Online, of an article by W. Michael Cox and Richard Alm in the 1999 Annual Report of the Federal Reserve Bank of Dallas, available at http://www.bls.gov/.
4. This is based on my personal recollection of debating with Desai at LSE and Minford at Cardiff University at the time.
5. Financial Times, 11 September 2001.
6. See, for instance, US Recession May Have Ended Before It Began, Financial Times, 1 March 2002.
7. World Bank, World Development Indicators.
8. For further discussion on this, see my response, Misreadings and Misconceptions to Jim Kincaid, The World Economy – A Critical Comment, in International Socialism, 119 (2008).
9. Marco Terrones and Roberto Cardarelli, Global Imbalances, A Saving and Investment Perspective, World Economic Outlook, International Monetary Fund, 2005, Chapter Two (Fig. 2.1) available at http://www.imf.org (download).
10. David Kotz, Contradictions of Economic Growth in the Neoliberal Era, Review of Radical Political Economy, 40:2 (2008).
11. Fred Moseley, Is The US Economy Headed For A Hard Landing?, available at http://www.mtholyoke.edu (download).
12. Kerry A. Mastroianni (ed.), The 2006 Bankruptcy Yearbook and Almanac, Chapter 11, available from http://www.bankruptcydata.com/Ch11History.htm [no longer available online].
13. Joseph Stiglitz, The Roaring Nineties: Why We’re Paying the Price for the Greediest Decade in History (Harmondsworth, Penguin, 2004).
14. Gareth Dale, Between State Capitalism and Globalisation (Peter Lang, 2004), p. 327.
15. R. Honohan and D. Klingebiel, quoted in Charles Goodhart and Dirk Schoenmaker, Burden Sharing in a Banking Crisis in Europe, available at http://www.riksbank.com [Article only available at various websites behind paywalls].
16. See the OECD report on these questions, Government Policies Towards Financial Markets, Paris 1996, available at http://www.olis.oecd.org.
17. Fred Magdoff, The Explosion of Debt and Speculation, Monthly Review, 58:6 (2006), p. 5.
18. Stefano Scarpetta, Andrea Bassanini, Dirk Pilat and Paul Schreyer, Economic Growth in the OECD Area: Recent Trends at the Aggregate and Sectoral Level, OECD Economics Department Working Papers 248 (2000), p. 26.
19. Figures supplied by Robert Brenner at the Historical Materialism Conference, London 2007.
20. Table from Stefano Scarpetta, Andrea Bassanini, Dirk Pilat and Paul Schreyer, Economic Growth in the OECD Area: Recent Trends at the Aggregate and Sectoral Level.
21. As above, p. 30.
22. For mainstream economic discussions on the increased rate of depreciation due to computerisation, see Stacey Tevlin and Karl Whelan, Explaining the Investment Boom of the 1990s, Journal of Money, Credit and Banking, 35 (2003); for an earlier discussion on the shortening of the lifetime of fixed capital and thus of increasing depreciation rates, see Martin S. Feldstein and Michael Rothschild, Towards an Economic Theory of Replacement Investment, Econometrica, 42:3 (1974), pp. 393–424. They suggest “a significant change in the average expected age of new non-farm investment ... from 19.8 years in 1929 to 15.3 years in 1963.”
23. Total labour compensation, including employers’ social security and pension contributions and imputed labour income for self-employed persons. For figures, see http://ocde.p4.siteinternet.com/publications/doifiles/812007131G25.xls [no longer available online]. There would seem to be problem with using these figures to compare labour-shares from country to country, as opposed to over time, since other data indicate a much higher share of capital accumulation in Japan than in the US and Western Europe.
24. Chuck Collins, Chris Hartman and Holly Sklar, Divided Decade: Economic Disparity at the Century’s Turn, United for a Fair Economy, 15 December 1999.
25. See the graph in G. Duménil and D. Lévy, Capital Resurgent, p. 46.
26. International Labour Organisation figures, available from http://www.ilo.org. The figures given by various sources vary considerably, depending on how they count part-time working and whether they take into account unpaid overtime measurements. Other figures, based on reports from firms, show a bigger rise than do the ILO figures.
27. BBC report, 5 September 2005.
28. Anwar Shaikh, Who Pays for the ‘Welfare’ in the Welfare State?
29. Table from Duane Swank and Cathie Jo Martin, Employers and the Welfare State, Comparative Political Studies, 34:8 (2001), pp. 917–918.
30. Figures from US Department of Labor, Organization for Economic Cooperation and Development. There are discrepancies with the ILO figures for individual countries, but the same overall pattern between countries.
31. Productivity per worker in France was only 70 percent of that in the US, but productivity per hour worked is 5 percent higher – figures for the year 2000 from EU, Ameco data base, given in Olivier Blanchard, European Growth over the Coming Decade, September 2003. See http://www.mit.edu.
32. Details from Stefan Bornost, in Germany: The Rise of the Left, International Socialism, 108 (2005).
33. Stephen Broadberry, The Performance of Manufacturing, in Roderick Floud and Paul Johnson, The Cambridge Economic History of Modern Britain (Cambridge 2004), p. 59; Office of National Statistics, Monthly Digest of Statistics, July 2007, Table 7.1.
34. For greater detail, see Chris Harman, Where is Capitalism Going: Part Two, International Socialism, 60 (1993), pp. 98–101.
35. Chen Zhan, editor of The China Analyst, June 1997.
36. Ching Kwan Lee, ‘Made in China’: Labor as a Political Force?, University of Montana, 2004, available on http://www.umt.edu.
37. For the full story see the issues of the China Daily (Beijing) for the second week of August 2005.
38. C. Guidi and W. Chuntao, Survey of Chinese Peasants, quoted in Yang Lian, Dark Side of the Chinese Moon, New Left Review, 2:32 (2005), available at http://www.newleftreview.net.
39. South China Post, quoted in M. Hart Landsberg and P. Burkett, China and the Dynamics of Transnational Accumulation, paper given at conference on The Korean Economy: Marxist Perspectives, Gyeongsang National University, Jinju, South Korea, 20 May 2005, p. 24.
40. Figure given by Martin Wolf, in Fixing Global Finance (New Haven, Yale University Press, 2008), p. 165.
41. Steven Barnett and Ray Brooks, What’s Driving Investment in China?, IMF Working Paper 265 (2006), available at http://ideas.repec.org [download].
42. As above.
43. Jahangir Aziz and Li Cui, Explaining China’s Low Consumption: The Neglected Role of Household Income, IMF Working Paper 181 (2007), available at http://www.imf.org.
44. As above.
45. From Jahangir Aziz and Steven Dunaway, China’s Rebalancing Act, Finance and Development, IMF, 44:3 (2007) available at http://www.imf.org.
46. Figure quoted in M. Hart Landsberg and P. Burkett, China and the Dynamics of Transnational Accumulation, p. 5.
47. Quoted by J. Kynge, Financial Times, 23 September 2003.
48. Financial Times, 4 February 2003.
49. Quoted in Financial Times, 18 November 2003.
50. Jonathan Anderson, Solving China’s Rebalancing Puzzle, Finance and Development, IMF, 44:3 (2007), available at http://www.imf.org.
51. Ray Brooks, Labour Market Performances, in Eswar Prasad (ed.), China’s Growth and Integration in the World Economy (IMF, 2004).
52. The “secondary sector” includes construction, water, electricity generation, etc., as well as manufacturing.
53. Steven Barnett and Ray Brooks, What’s Driving Investment in China?, p. 5.
54. Phillip Anthony O’Hara, A Chinese Social Structure of Accumulation for Capitalist Long-Wave Upswing?, Review of Radical Political Economics, 38 (2006), pp. 397–404. But as with all calculations of profit rates, there can be doubts as to the accuracy of the statistics he bases his calculations on – particularly since his figures indicate a decline in the rate of exploitation, which hardly fits in with the declining proportion of wages and consumption in GNP shown in Jahangir Aziz and Li Cui, Explaining China’s Low Consumption: The Neglected Role of Household Income.
55. Figures given in Jesus Felipe, Editha Lavina and Emma Xiaoqin Fan, Diverging Patterns of Profitability, Investment and Growth in China and India during 1980–2003, World Development, 36:5 (2008), p. 748.
56. Zhang Yu and Zhao Feng, The Rate of Surplus Value, the Composition of Capital, and the Rate of Profit in the Chinese Manufacturing Industry: 1978–2005, paper presented at the Second Annual Conference of the International Forum on the Comparative Political Economy of Globalization, 1–3 September 2006, Renmin University of China, Beijing, China.
57. Quoted in J. Kynge, Financial Times, 23 September 2003. See also Steven Barnett, Banking Sector Developments, in Eswar Prasad (ed.), China’s Growth and Integration in the World Economy.
58. Steven Barnett and Ray Brooks, What’s Driving Investment in China?, p. 17.
59. Sebastian F. Bruck, China Risks Caution Overkill After Bear Prudence, Asia Times, 26 March 2008.
60. Quoted in Jahangir Aziz and Steven Dunaway, China’s Rebalancing Act.
61. Thomas Lum and Dick K. Nanto, China’s Trade with the United States and the World, CRS report to Congress, January 2007, available at http://digitalcommons.ilr.cornell.edu.
62. China’s share of global output was estimated at 10.9 percent, the US’s at 21.4 percent. See Selim Elekdag and Subir Lail, Global Growth Estimates Trimmed After PPP Revisions, IMF Survey Magazine, 8 January 2008.
63. See Financial Express, 30 April 2004, available at www.financialexpress.com [unable to find article]
64. Petia Topalova, India: Is the Rising Tide Lifting All Boats?, IMF Working Paper, WP/08/54, March 2008, available at www.imf.org.
65. A. Banerjee and T. Piketty, Top Indian Incomes, 1922–2000, World Bank Economic Review, 19:1, pp. 1–20, quoted in Petia Topalova, India: Is the Rising Tide Lifting All Boats?
66. Abhijit Sen and Himanshu, Poverty and Inequality in India: Getting Closer to the Truth, Ideas, 5 December 2003, available at http://www.networkideas.org. There has been a very long discussion on how to interpret the official figures in various articles in the Economic and Political Weekly.
67. Figure for 1992 from Abhijit Sen, Force, 20 April 2004.
68. Abhijit Sen, Force, 20 April 2004.
69. Sukti Dasgupta and Ajit Singh, Manufacturing, Services and Premature De- Industrialisation in Developing Countries, Centre for Business Research, University Of Cambridge Working Paper 327.
70. Figures given in Ministry of Labour and Employment, India, Informal Sector In India , Approaches for Social Security.
71. Labour Shortage Threat to Indian Call Centre Growth, UNI 2006, http://www.uni-ilc.org/docs/Labour%20shortage%20threat%20to%20Indian%20call%20centre%20growth.pdf [no longer available online].
Last updated on 7 May 2021