IMR Index | Main Newspaper Index
Encyclopedia of Trotskyism | Marxists’ Internet Archive
From Irish Marxist Review, Vol. 6 No. 18, July 2017, pp. 70–72.
Copyright © Irish Marxist Review.
The links have been checked and modified where necessary (December 2021).
A PDF of this article is available here.
Transcribed & marked up by Einde O’Callaghan for the ETOL.
|
|
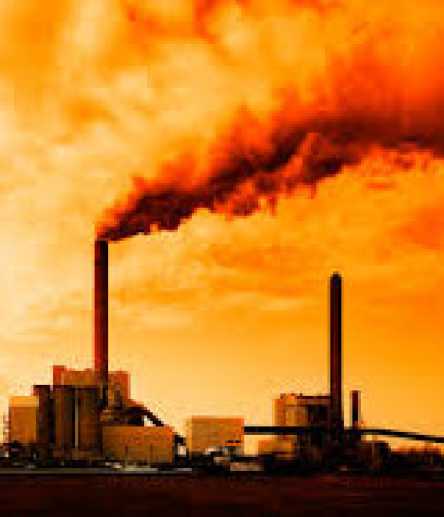
Ever since the 1960’s, people all around the world have expressed their fears and alarm at the devastating effect that toxic emissions from fossil fuels, industrial chemicals, mining, nuclear power, the military use of chemical agents and nuclear bombs such as at Hiroshima and Nagasaki are having on human life, animal species and on the planet.
You don’t have to be a scientist to be worried that temperatures and sea levels are rising, droughts are common place and that species of animals, insects and nature are disappearing. However, good science has shown that people are right to be alarmed. Countless environmental studies testify to the result of this chemical cocktail of sulphur dioxide, nitrogen and methane etc. on the atmosphere, winds, rivers, seas and oceans, in fact on the whole ecosystem of the planet by acidified rain, fog, and snow.
In 1996 the World Watch Institute report, proclaimed scientists fears for the 70 to 95 percent of the earth species living in the world’s disappearing tropical forest and for the health of future of generations to come. Their study showed that by 1996 25 million people had died from contaminated water. Furthermore, they predicted that by 2025 as many as 3 billion people could be living with chronic water scarcity and that by 2020 10 million species could become extinct. Yet world governance has chosen to systematically ignore this evidence. The Bush administration dismantled environmental protective legislation and increased the exploitation of oil and mining industries and even denied climate change.
At a time when global capitalism is fully aware of the harm to humankind now and the threat to future generations (IPCC 2007; World Bank 2012b; Hoeppe 2011; Busby 2007), oil and gas today account for 56% of total energy consumption and oil companies are predicting that the world demand for energy in the next 20 years is expected to grow by 30% (BP shareholder report 2016). Indeed western powers have chosen to go to war in the pursuit of oil and mining rights in Iran and Iraq with catastrophic effect on their civilisations. Now the Trump regime has removed all evidence of climate change from the American Environmental Protection website and withdrawn from the (limited and inadequate) Paris Climate Accords.
The following diagrams with explanations come from a study carried out by R. Heede, Exploring the historic emissions of fossil fuels from 1854 to 1910, in the journal Climatic Change.
They show the exponential increase in fossil fuel emission from 1854 to 2010. A total of 914 billion tonnes of CO2 – equivalent has been traced to 90 international entities. These entities cumulatively produced 985 billion barrels (bbl) of crude oil and NGLs (79 billion were used for non-energy products), 2,248 trillion cubic feet (Tcf), and 163 billion tonnes of various ranks of coal. The emissions traced to the carbon majors represent 63 % of global industrial CO2 and methane from fossil fuel combustion, flaring, venting, fugitive or vented methane, own fuel use, and cement between 1751 and 2010
|
Table 1: Industrial CO2 and CH4 emissions: |
|||
|---|---|---|---|
|
Source |
Carbon majors |
CDIAC |
Carbon majors |
|
Oil & NGLs |
365.7 |
72.0 |
77.5% |
|
Natural Gas |
120.1 |
176.1 |
68.2% |
|
Coal |
329.6 |
642.5 |
51.3% |
|
Flaring |
6.0 |
12.6 |
47.9% |
|
Cement |
13.2 |
32.5 |
40.6% |
|
Vented CO2 |
4.8 |
n/a |
n/a |
|
Own fuel use |
7.1 |
n/a |
n/a |
|
Fugitive methane |
67.6 |
114.6 |
59.0% |
|
Sum |
914.3 |
1,450.3 |
63.0% |
|
Global CO2 combustion data is from CDIAC; |
|||
I have included this extract in full as it explains historic emissions and the diagrams.
Of total industrial CO2 and CH4 emissions from 1751 to 2010, one-half has been emitted since 1984 (Marland et al., 2011). Of the emissions traced to carbon major fossil fuel and cement production, half has been emitted since 1986 (Fig. 1). Cumulatively, emissions of 315 GtCO2e have been traced to investor-owned entities, 288 GtCO2e to state-owned companies, and 312 GtCO2e to nation-states (Fig. 2). The dip in relative production by nation-states in the late 1980s through early 2000s is due to the collapse of the Soviet Union and the creation of new state-owned oil and natural gas entities in Russia as well as the transformation of China’s petroleum sector into state-owned entities.
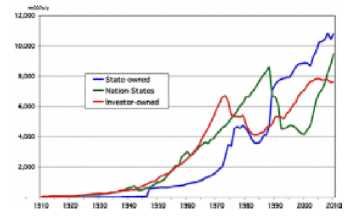
Fig. 2. Carbon Majors’ emissions by ownership category, 1910–2010. The total historic contributions of each ownership category are nearly equal: 34.4% investor-owned (red), 34.1% nation-states (green), and 31.5% state-owned (blue), but the proportions vary over time. Cumulative emissions attributed to the twenty largest investor-owned and state-owned energy companies between 1854 and 2010 total 428 GtCO2e, or 29.5% of global industrial emissions from 1751 to 2010 (Table 3). The ten largest investor-owned companies alone contributed 230 GtCO2e, or 15.8% of global emissions through 2010. |
It is common for people to think of these emissions in terms of nation states, however, while nation states enable the oil and mining industries to operate freely, Russia, China and India have also formed their own oil exploration companies, so the increase in global emissions since the mid 1980’s needs to be considered in terms of the cumulative effect of these three forces. The list below shows the top 10 oil producing companies also sourced from Heede (2014).
|
Entity |
MtCO2e |
MtCO2e |
% |
|
1. Chevron, USA |
423 |
51,096 |
3.52% |
|
2. ExxonMobil, USA |
655 |
46,672 |
3.22% |
|
3. Saudi Aamco, Saudi Arabia |
1,550 |
46,033 |
3.17% |
|
4. BP, UK |
554 |
35,837 |
2.47% |
|
5. Gazprom, Russian Federation |
1,371 |
32,136 |
2.22% |
|
6. Royal Dutch/Shell, Neatherlands |
478 |
30,751 |
2.12% |
|
7. National Iranian Oil Company |
876 |
29,084 |
2.01% |
|
8. Pemex, Mexico |
602 |
20,025 |
1.38% |
|
9. ConocoPhilips, USA |
359 |
16,866 |
1.16% |
|
10. Petroleos de Venezuela |
485 |
16,157 |
1.11% |
|
11. Coal India |
830 |
15,493 |
1.07% |
|
12. Peabody Enegy, USA |
519 |
12,432 |
0.86% |
|
13. Total, France |
398 |
11,911 |
0.082% |
|
14. PetroChuna, China |
614 |
10,564 |
0.73% |
|
15. Kuwait Petroleum Corp. |
323 |
10,503 |
0.73% |
|
16. Abu Dhabi NOC, UAE |
387 |
9,672 |
0.67% |
|
17. Sonatrach, Algeria |
386 |
9,263 |
0.64% |
|
18. Consol Energy, Inc, USA |
160 |
9,096 |
0.63% |
|
19. BHP-Billiton, Australia |
320 |
7,606 |
0.52% |
|
20. Anglo American, UK |
242 |
7,242 |
0.50% |
|
Top 20 IOCs & SOEs |
11,523 |
428,439 |
29.54% |
|
Top 40 IOCs & SOEs |
— |
546,767 |
37.70% |
|
All 81 IOCs & SOEs |
18,524 |
602,491 |
41.54% |
|
Total 90 Carbon Majors |
27,946 |
914,251 |
63.04% |
|
Total Global Emissions |
36,026 |
1,450,332 |
100% |
Looking then at the assets of the top 5 oil companies for 2016 we can clearly see that the driving force has been profit and accumulation.
|
Company |
Assets |
|
Royal Dutch Shell |
$411.2 bn |
|
Chevron |
$260.1 bn |
|
ExxonMobil |
$330.3 bn |
|
Saudi Armaco |
$2.25 tn |
|
BP |
$195,503 m |
Just looking at BP alone, we find from their 2016 annual report that their shareholders received $7.5 billion in payments despite the oil company been responsible for oil accidents and spillages at Deepwater Horizon in 2010 and the Gulf of Mexico costing them $1.63 billion and $6.9 billion in fines, litigation and repairing the environmental damage. The report also reveals that Tom Sawyer, previously employed by M16, sits as an advisor to BP management.
Looking at the top mining companies listed below we can also see that the pursuit of profit is the number on priority for global capitalism regardless of the ecosystem and human need.
|
Top Mining Companies |
|
|---|---|
|
Glencoe Xstrata |
$209.2 Billion Assets |
|
BHP Billiton |
$69.4 Billion Assets |
|
Rio Tinto |
$45.1 Billion Assets |
|
China Shenkua Energy |
$40 Billion Assets |
|
Vale |
$33.2 Billion Assets |
I take no pleasure in documenting what is happening to our planet and humankind as it is truly horrific, especially when you consider the future for the children of the world. Tribal groups of people used to consider that the natural environment as a heritage to be used and cared for by the present generation in a manner that would allow future generations to live. [Even western powers are aware of the tribal custom of living in harmony with nature and call it sustainable development.] And Marx wrote eloquently on the same theme: as early as 1844 in his Economic and Philosophic Manuscripts he stated:
Man lives on nature – means that nature is his body, with which he must remain in continuous interchange if he is not to die. That man’s physical and spiritual life is linked to nature means simply that nature is linked to itself, for man is a part of nature. [1]
And in his great work Capital he wrote:
From the standpoint of a higher socio-economic formation, the private property of particular individuals in the earth will appear just as absurd as the private property of one man in other men.
Even an entire society, a nation or all simultaneously existing societies taken together are not owners of the earth, they are simply its possessors, its beneficiaries, and have to bequeath it in an improved state to succeeding generations, as boni patres familias [good heads of house-holds]. [2]
We need to protect our planet for future generations in a world that recognises that people come before profit.
Heede, R., Climatic Change (2014) 122: 229.
List of largest mining companies by revenue, Wikipedia, October 2016.
New International: Numbers: 269, 278, 287, 289.
Lester R. Brown et al., State of the World: A Worldwatch Institute report, London Earthscan Publications 1996.
1. Karl Marx, Economic and Philosophical Manuscripts, Labour.
2. Karl Marx, Capital, Vol. 3, Ch. 46, Moscow 1966, p. 776.
IMR Index | Main Newspaper Index
Encyclopedia of Trotskyism | Marxists’ Internet Archive
Last updated on 30 December 2021