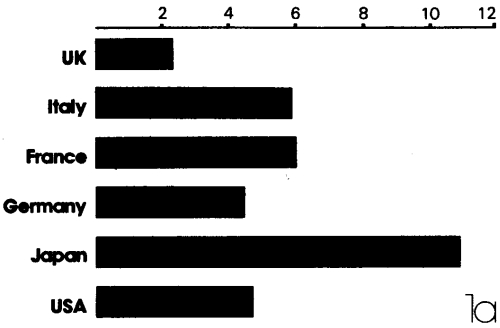
INCREASE IN OUTPUT PER YEAR 1964-1975
in manufacturing industry
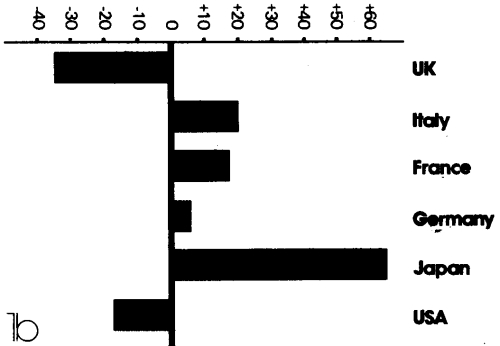
CHANGE IN SHARE OF WORLD EXPORTS
OF MANUFACTURERS 1964-1975
(per cent)
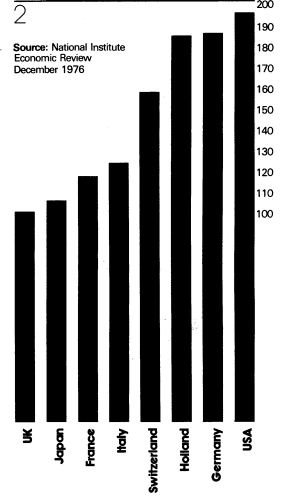
Source: National Institute Economic Review, December 1976
ISJ Index | Main Newspaper Index
Encyclopedia of Trotskyism | Marxists’ Internet Archive
From International Socialism (1st series), No.95, February 1977, pp.15-18.
Transcribed & marked up by Einde O’Callaghan for ETOL.
There can be no doubt that British capital is weaker than its major rivals. In the decade from 1964 to 1975, the British share of world exports of manufactured goods was almost halved. Among the six largest exporters of manufactured goods, Britain had the slowest growth rate, and the slowest increase in productivity.
See tables 1a and 1b
|
INCREASE IN OUTPUT PER YEAR 1964-1975 |
| |
|
|
| |
|
Source: National Institute Economic Review, December 1976 |
Why is this? It is certainly not high wages. By 1974, before the Social Contract, wage costs in Britain had become the lowest among the fifteen major Western economies.
See table 2
|
LABOUR COSTS IN |
 |
This includes social charges carried by the employer such as employer contributions to social security. Since then wages in Britain have fallen even further behind.
Between 1970 and 1975 – the period of the so-called wage explosion – earnings in Britain rose at about the same rate as elsewhere. The rise in hourly earnings was almost exactly the same as in France and Belgium, slightly faster than in Germany, North America and Scandinavia, but lower than in Italy, Holland or Denmark.
But since consumer prices rose faster here than in most other industrial countries, the improvement in real earnings was less than anywhere else except Sweden and North America.
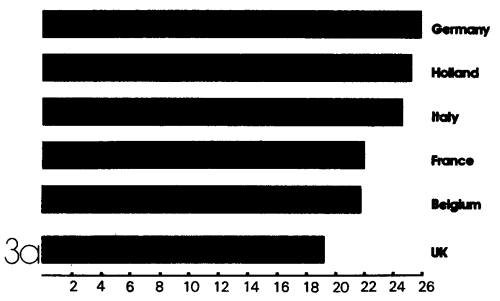
Despite the massive propaganda effort to persuade us to accept the cuts, the weakness of British capitalism is not that too high a proportion of the national income is spent on welfare.
See table 3a
|
PROPORTION OF NATIONAL INCOME |
 |
|
Source: Statistical Office of the European Communities |
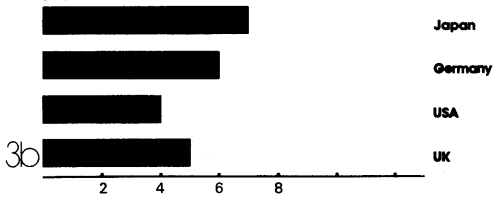
Nor is it because the government spending deficit is too large.
See table 3b
|
CENTRAL GOVERNMENT DEFICIT |
 |
|
Source: Neild & West, Cambridge Department of Applied Economics, July 1976 |
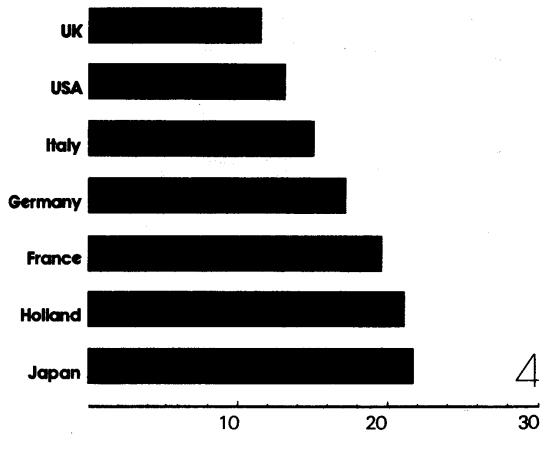
The left has long isolated underinvestment in British industry, and particularly investment abroad by British multinationals, as a root problem.
‘The thirty leading British manufacturing companies ... produced goods at home worth £18,000 million in 1975-76, of which £3,470 million were exported. Their total overseas production was £16,280 million or 90 per cent of their home production, and four and a half times greater than their exports from the UK. Overseas investment was running at an annual rate of £1,500 million a year by early 1976.
‘For Britain at the present time the two top priorities are higher exports and more investment ... The interest of British multinationals are in conflict with the national need for exports and investment.’ (Labour Research, September 1976).
But this begs the question. There certainly has been for many years and still is severe underinvestment in the British economy.
See table 4
|
INVESTMENT |
 |
|
Source: IMF Financial Statistics, OECD Main Economic Indicators |
But why? Why has the ruling class not made the necessary investment to maintain Britain’s competituve position? Why is it more profitable to invest elsewhere?
The strength of shop-floor organisation in Britain is at least part of the answer. Employers’ efforts to impose ever higher rates of exploitation have been less successful in Britain than they have elsewhere.
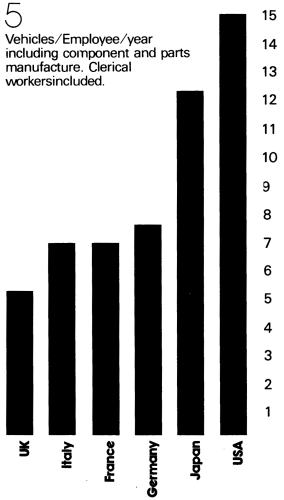
The Think Tank’ report on the motor industry concluded ‘the man hours required in Britain to assemble the same, or a similar, car are almost double those required on the continent ... Either twice as many men are required to produce the same number of cars ... or equally manned lines are half as productive.’ (CPRS report The British Motor Industry 1976) A secret report comparing Ford operations at their new plant in Halewood with Genk in Belgium found that ‘one of Britain’s newest car plants operates less efficiently than a comparable factory on the Continent.’ (Financial Times, 25.11.76). The report, compiled by top level managers, shop stewards, civil servants and union officials including Bob Wright and Moss Evans, goes a long way to confirming the Think Tank’s’ conclusions.
See table 5
|
PRODUCTIVITY |
 |
|
Source: CPRS Report on the Motor Industry |
A recent study compared productivity in British and overseas factories of international companies. It found that compared with the UK, labour productivity in the USA is over 50 per cent higher, in Germany it is over a third higher and in France over a quarter higher. In comparing output in British and Swedish companies, it found that output per employee was 50 per cent higher than for the UK companies.
‘The freedom of employees to strike without the support of their union is limited in Sweden. Such strikes are illegal and the same applies to official strikes after a union has agreed to enter negotiations. Employers have had a prerogative to fix the manning of new machines. In practice, managers of German companies have similar powers, but in the UK employees often demand the right to negotiate the manning of new machinery and/or a substantial pay increase to operate it. More generally, the equivalents of the TUC in Sweden and Germany have more influence and authority in relation to member unions than has the TUC; and, overseas, the central authorities of trade unions have more influence and power relative to branches than in Britain’ (Lloyds Bank Review, January 1977).
As well as more men per machine, restriction of function and job reservation are isolated for particular blame ...
‘For example, machine operators may not be responsible for keeping their section of a factory clean (this work being done by cleaners); operators may not be responsible for checking the quality of the products they make, and this may necessitate the employment of more inspectors; operators may not be allowed to put right or attempt to put right, faults in a machine or to set up a machine; specialist personnel may themselves operate demarcation rules.’ (ibid.)
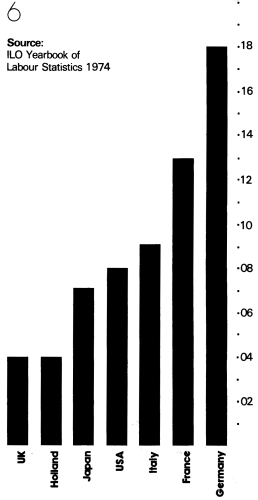
The relative success of British workers in defending themselves against management efforts to push up the rate of exploitation is clearly reflected in the figures for fatal accidents at work.
See table 6
|
FATAL ACCIDENT RATES IN |
 |
In the Herculean task of propping up the profitability of British industry, cutting real wages and shifting wealth from the welfare state to company profits is not enough. Productivity must be raised, and this will mean attacking shop-floor organisation that, although muffled over the past two years, remains intact.
The route to higher exploitation is through greater control over the work force. High unemployment contributes to greater ‘discipline’, but this is not enough. Mobility of labour within the plant, more flexibility in terms of job definition and an end to unofficial action are the demands that are being pressed harder and harder.
The new Leyland deal offers a large package of fringe benefits such as injury and sick pay, lay off and redundancy benefits, in return for ‘co-operation in substantially reducing unauthorised absence and unconstitutional industrial action’. The penalty for unofficial action which lasts for half a shift or a total of eight hours is loss of three months benefits.
‘Leyland Cars’ 90,000 manual workers are being urged by their trade union leaders to accept a large package of fringe benefits which would make them pacesetters for industry.’ (FT, 17.1.77)
1977 is going to be a year of attack on shop floor organisation.
ISJ Index | Main Newspaper Index
Encyclopedia of Trotskyism | Marxists’ Internet Archive
Last updated on 8.2.2008