ISJ Index | Main Newspaper Index
Encyclopedia of Trotskyism | Marxists’ Internet Archive
From International Socialism (1st series), No. 98, May 1977, pp. 18–22.
Transcribed by Christian Høgsbjerg, with thanks to Sally Kincaid.
Marked up by Einde O’Callaghan for ETOL.
|
American capitalism is still the greatest power in the world today, despite the defeats it suffered at the hands of the national liberation movements in Indochina and despite the economic crisis of the last four years. The fate of world revolution will depend ultimately on whether the American working class seizes power in the stronghold of international capitalism. Milton Fisk is a member of the new US revolutionary group the International Socialist Organisation, which has fraternal links with the SWP (GB). In this article he explores the contradictions of American capitalism and traces out the possibilities for working-class struggle. |
THE cold wave of early 1977 was the worst in half a century. It intensified the contradictions already existing in the US economy of the 1970s. Those contradictions are the product of deepening economic stagnation.
The big oil companies – Exxon, Texaco, Gulf – are also the biggest natural gas producers. With 40 million homes, 3.4 million commercial buildings, and 193,000 factories heated by natural gas, the energy empire won a double victory from the cold wave. First-quarter profits to the energy producers will be stupendous, and the ceiling on the price of natural gas sold between states will be raised. The ceiling is already almost three times the $0.52 per thousand cubic feet it was until recently. Now the $1.42 ceiling can be expected to rise to around $2.40 as a result of legislation to be proposed by President Carter on April 20.
This rise will have a serious impact on the attempt to overcome economic stagnation. Higher energy costs will be a further obstacle for many industries to increasing capital spending on plant and equipment. It is the recovery of capital spending that is the economic priority of both the capitalist class and the Carter administration. Giving a disproportionate share of the nation’s disposable capital to the energy empire will make relatively less capital available to certain other sectors. One sector’s super profits are laying a firmer foundation for continued economic stagnation.
Carter ran for the presidency on a platform of deregulating the natural gas industry (i.e., raising their prices). But he is now faced squarely with the contradiction between anarchistic monopoly profiteering and integrated recovery from stagnation. The energy monopolies prepared their trap well in advance. They have systematically curtailed drilling and pipe-laying operations. Texaco is withholding half a trillion cubic feet of gas in two non-producing fields off the coast of Louisiana. At the same time the oil companies have tightened their grip on the overall energy industry by expanding their coal operations. It is then no surprise that the Carter energy bill will encourage industries to convert to coal. Standard Oil and Gulf will have landslide profits whatever happens.
Carter actually has little choice: the contradiction will be resolved to favour the monopolies. On the one hand, the small, millionaire operators alone could have been forced to pump gas this winter. But Exxon and Texaco stood between them and the White House. The result was that factories were closed and schoolchildren were sent home. On the other hand, lower unemployment and a resurgence of capital spending are not likely in the near future. The sluggish recovery from the cyclical crisis of 1974–75 is a symptom of long-term stagnation, a stagnation that began in the late 1960s and that has not yet reached its deepest point. Even if Carter could avoid giving in to the energy empire, he stands little chance of ending stagnation.
Other corporations will attempt to follow the lead of the oil companies. How else can they cope with the problem of receding profit levels in a period of stagnation? Induced shortages, attacks on regulations, and bursts of profiteering will give the corporations in a particular sector temporary relief from generally lower profit rates. In addition to natural gas, there are already examples of gasoline, wheat, paper, sugar, soya beans and coffee.
‘WITH the economy already recovering, a little stimulus will go a long way,’ says the business magazine Fortune (Jan ’77) in its editorial forecast on the economy up to mid-1978. Optimism is exaggerated here to keep the Carter administration’s stimulation programme from reducing unemployment enough to increase labour militancy and from advancing to full plant utilization so fast that costs of capital goods will soar. As a result of this pressure, Carter abandoned his proposed tax-cut in mid-April.
Even before its castration, the Carter programme consisted of tax benefits, public works, and job training that would provide a stimulus of less than one per cent of gross national product (GNP) for each of 1977 and 1978. It was not designed to reduce unemployment to pre-recession levels, but only to slightly below 7%. This would mean an official unemployment count of six and one-half million persons. It is still possible to increase GNP with this high level of unemployment. Part of the reason is that the mass of employed persons is still growing. But crucial to the whole strategy is a continuation of large annual increases in output per worker hour – productivity.
Despite productivity increases, the ‘reaccelerating’ economy is a figment of capitalist apologists. Business investment in the last quarter of 1976 was only 3% above its lowest point in the recession. (By contrast, one year and a half after the recession of 1960–61, investment was up 12% from its lowest point.) The mass and rate of unemployment actually worsened during 1976. The real weekly earnings of workers have only now recovered their 1974 level. They are still below their 1973 high.
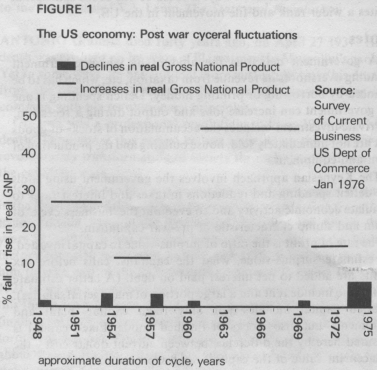
A strong recovery is then not so much a reality as an attempt to convince workers that 7–8% unemployment is ‘natural’ and that continuing the increase of productivity at a 3.5–4% annual rate is the only way for a ‘free’ economy to survive. The idea of a strong recovery has the additional appeal that it has become almost axiomatic that there be a strong recovery after every down-swing in the business cycle. Indeed big gains were made during recoveries in the 1946–69 period (see Figure 1).
| |
But the difference is that this recovery is taking place in a period of long-term stagnation. Such a period embraces a number of fluctuations of the business cycle, of which the 1969–70 recession was the first. The 1973–75 recession was a deeper fluctuation in te same period of stagnation, and the recovery has been shallow. Deeper recessions and shallower recoveries are characteristic of business cycles as a period of stagnation progresses.
Carter’s stimulation programme, small as it is, detracts attention from the real role of the government in recovery. The recession brought on huge federal deficits, simply through a drop in federal revenues. [1] Carter’s programme of $15 billion for each year is dwarfed by the $60–70 billion deficits for 1975 and 1976. His pledge to balance the budget by 1981 leaves lots of room for continuing sizeable deficits. These deficits are much larger than those incurred in the wake of previous recessions (see Table 2).
|
Table 2 MILITARY SPENDING (U.S.) |
|||||||
|
Year |
|
GNP |
|
Military |
Military-Related |
(2)/(3)×100% |
(3)/(2)×100% |
|---|---|---|---|---|---|---|---|
|
1946 |
209 |
4.8 |
— |
2.3 |
— |
||
|
1953 |
366 |
49 |
16 |
13.4 |
33 |
||
|
1961 |
523 |
47 |
17 |
9.2 |
36 |
||
|
1966 |
753 |
60 |
25 |
8.0 |
41 |
||
|
1973 |
1,306 |
75 |
56 |
5.6 |
49 |
||
|
1974 |
1,415 |
77 |
37 |
5.5 |
48 |
||
|
1975 |
1,516 |
84 |
40 |
5.5 |
46 |
||
|
1976 |
1,691 |
88 |
42 |
5.2 |
48 |
||
|
(Source: S.C.B., Jan. ’76, Pt. I; Feb. ’77) |
|||||||
Deficit spending is between a third and a quarter of private investment. [2] This indicates that private mechanisms for growth have been seriously weakened. The expansionist forces of the post-World War II boom are not evident in this sluggish recovery. The relative size of the deficit attests to a developing period of stagnation. When investment cannot expect an acceptable rate of return, deficit spending serves to prevent unemployment and wage cutting reaching politically dangerous proportions.
THE current stagnation in the US economy was preceded by a long period of economic ascent. That period began with the rise of military production as the US prepared to enter World War II. The phenomenon continued, with unevennesses due to the business cycle, until the last half of the 1960s. It spread to other capitalist countries resulting in an international capitalist boom whose end coincided with the winding down of the Vietnam War.
This quarter-century of relative prosperity was characterised by lower unemployment, more rapid growth of capital spending, less corporate debt, and greater price stability. If these were the crucial indicators, it was the rate of profit that provided the basic force. There was a higher ratio of profits to invested capital. The decrease of this ratio has led, since the mid-1960s, to increased federal deficits, greater corporate debt, higher unemployment, sluggish capital investment, and inflation.
The capitalist economy has a chronic problem with the rate of profit. There are, though, periods like the post-World War II period when the problem seems to have disappeared. The prosperity of the post-World War II period has led even Marxist economists to doubt that there is a tendency of the rate of profit to fall. But such a period is sandwiched between long economic declines. It is made possible only by incorporating mechanisms on a relatively permanent basis that induce an upswing. Military spending was chief among these mechanisms in ending the stagnation of the Great Depression and sustaining an upswing through the mid-1960s.
The counter-cyclical mechanisms characteristic of the Keynesian approach have to be distinguished from mechanisms that create conditions for long-term prosperity. [3] The permanent arms economy that began in the US in 1940–41 had several features that made it a successful mechanism for inducing an upswing and sustaining it.
First, since arms quickly became obsolete in an international arms race, the arms industry is being constantly revolutionised. Before the industry gluts the market with certain military hardware, the industry is transformed with the demand for new hardware. Second, technological developments associated with military spending were able to sustain high productivity in non-military industries in the 1950-60s. Space research led to strides in electronics. Air Force sponsored research made possible the so-called numerical control of machines that were previously used by skilled craftspeople. Third, sinking capital funds in military spending tends to slow the rate of growth of investment in numerous non-military areas. This forestalls, in these areas, the falling rate of profit, which is caused by the difficulty of getting an ever larger mass of profits to match an ever larger amount of capital invested in plant and equipment. [4]
These features of the permanent arms economy concern the long-term productivity and profitability of the economy as a whole. The mechanisms of Keynesian economics are aimed merely at stimulating demand in the short run. Thus, whereas deficit spending, tax breaks, and lower interest rates – all tools of Keynesian demand management – are occasioned by a down-turn of the business cycle, the permanent arms economy shows no pattern of response to the business cycle. The ratio of military spending to GNP remained roughly constant – around 5.5% – between 1973 and 1976 (see Table 2), despite the rapid change in the ratio of federal deficit to GNP (see Table 1).
|
Table 1 FEDERAL DEFICITS AND RECESSIONS (U.S.) |
||||||
|
Year |
Deficit |
Deficit |
Private Sector |
Gross Private |
Deficit |
Deficit |
|---|---|---|---|---|---|---|
|
1949 |
2.6 |
6.2 |
426.7 |
35.3 |
1.5 |
7.4 |
|
1953 |
7.1 |
14.1 |
534.9 |
53.3 |
2.6 |
13.3 |
|
1958 |
10.3 |
17.7 |
586.1 |
61.9 |
3.0 |
16.6 |
|
1962 |
4.2 |
6.1 |
692.2 |
87.6 |
0.9 |
4.6 |
|
1967 |
13.2 |
18.2 |
874.6 |
120.8 |
2.1 |
10.9 |
|
1971 |
22.0 |
23.8 |
964.3 |
160.0 |
2.5 |
13.8 |
|
197: |
17.3 |
17.5 |
1,026.7 |
188.3 |
1.7 |
9.2 |
|
1973 |
6.9 |
6.5 |
1,087.0 |
220.5 |
0.6 |
3.1 |
|
1974 |
11.7 |
10.0 |
1,065.5 |
215.0 |
0.9 |
5.4 |
|
1975 |
71.2 |
54.8 |
1,042.6 |
183.7 |
5.3 |
38.8 |
|
1976 |
59.0 |
42.9 |
1,112.8 |
239.6 |
3.8 |
24.8 |
|
(Source: S.C.B., Jan., Pt. I, Sept., Oct., ’76; Feb. ’77) |
||||||
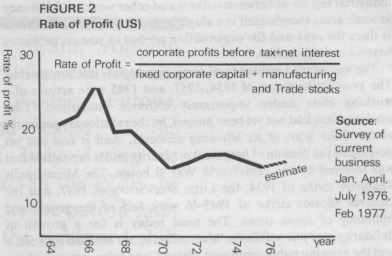
THOUGH the problem of the falling rate of profit could be forestalled, it could not be indefinitely postponed by the permanent arms economy. The rate of profit, after rising to a high of 25% in 1966, has shown a decline to 15% in the past decade (see Figure 2). Thus the rate of profit has dropped 40% in the first decade of stagnation.
 |
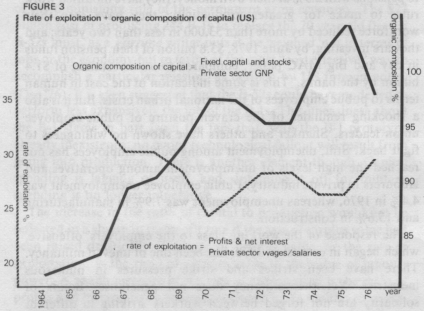
What was behind the slide in the profit rate? The major factor is capital accumulated in plant, equipment, and stocks. This invested capital has been growing without a proportional increase in production. Thus, from 1964, the ratio of fixed corporate capital and inventory to private-sector GNP has risen slowly from 81% to 98%. This increase has been reflected in the 40% slide in the profit rate. By adding capital to the advanced, enormous, and complex units of production that have come to characterise an ever larger segment of US industry, gains of the sort made in the 1950s and 1960s are no longer to be reached. This, in turn, has slowed capital spending, increased unemployment, enlarged corporate debt, and driven inflation up.
The permanent arms economy was able to forestall but not avoid altogether this stage of excessive capital overhead. Expansion was generalised, even though it was slowed by siphoning capital into arms. Military spending stretched out expansion in the capital sector starting from the depleted capital plant of the US at the time of World War II. But once the expansion had taken place to the point that profits are a dwindling portion of the capital plant, capital spending lags of itself. Military spending is not needed to siphon it off from non-military production areas. This is part of the reason why, after military spending remained at roughly 9% of GNP from 1954 through the Vietnam War, it dropped to roughly 5.5% of GNP in the mid-1970s (see Table 2). In addition, the wave of applications of scientific developments that the permanent arms economy made available to industry crested by the late 1960s.
The recent controversy over the B-l bomber reflects these facets of the diminishing role of the permanent arms economy. The $23 billion cost of producing 244 B-ls to replace the 20 year old fleet of B-52s must, as a Fortune writer puts it, be weighed ‘not in terms of jobs or the economy but in terms of the most “cost effective” way to accomplish a particular mission’ as defined by US foreign policy (Dec. ’76). It is even suggested that the B-52s could be remodelled to perform less expensively the job of the B-ls. This uneasiness about the B-l stems in part from the fact that, with the B-l prototype already in existence, no major technological fallout will result from going into production. There is another element though. Capital spending is lagging of itself, and siphoning it off for military spending is no longer imperative.
The increase in the ratio of capital to production would not be reflected in a slump in the profit rate if the rate of surplus value had been raised drastically. The rate of surplus value, or the rate of exploitation, is the ratio of surplus value to the value of labour-power. A rough measure of the rate of exploitation is the ratio of profits and interest to private wages and salaries. On this measure, since the mid-1960s, the rate of surplus value has, despite the employers’ offensive, certainly not increased. It has dropped 12%. The employers’ offensive against wages, working conditions, union representation, and job security has been necessary merely to level off the fall in the rate of exploitation. Since 1971, it has remained roughly constant. So the major source of the 40% decline in the rate of profit has not been the fall in the rate of exploitation but it has been the increasing ratio of capital to production. This ratio depends on the organic composition of capital, the amount of capital plant and equipment required per worker. A rough measure of the organic composition of capital is the ratio of fixed capital an inventory to private sector GNP. This ratio has increased 21% since the mid-1960s (see Figure 3).
 |
Since the problem is too much capital relative to output, capital spending will tend to decline. The average annual rate of growth of fixed capital formation dropped from 4.7% between 1960 and 197 to 3.0% between 1970 and 1974. In 1975, 12% less was invested in fixed capital than in 1974, and in 1976, there was only a 3% improvement over 1975. It is unlikely that before the long decline ends there will be another decade of sluggish investment in capital goods.
CARTER’S administration is not the first to try its hand at dealing with the economic slump. The Republican administrations of Nixon and Ford represented a somewhat less interventionist approach to the economy than is likely to be used under the Carter administration. But the ‘liberal’ capitalism of the Carter cabinet implies no major reforms of the economy.
The ruling class was unsure of the ability of the Ford administration to cope with the economy in a way that would maintain political stability. Carter comes in sharing the conviction of a powerful section of the ruling class that the health of the multinational corporations is the key to ending national and international stagnation. This is the view of the Trilateral Commission, organised in 1973 by David Rockefeller as one of the Rockefeller empire policy-planning groups. The President, the Secretary of State, the National Security Advisor, the Vice President, the Secretary of the Treasury, the Secretary of Defense and the Ambassador to the UN were all members of the Trilateral Commission. This commission groomed Carter and his cabinet for a reign that, with its progressive image, would be able to ride out the period prior to a return of economic growth without an upsurge of these bearing the brunt of the decline, the working-class.
Carter’s association with the multinational wing of US capitalism goes beyond the Trilateral Commission. Carter is surrounded by men who are associated with the Coca Cola empire. His Secretary of Health, Education and Welfare, Joseph Califano, defended the Coke orange-juice subsidiary, Minute Maid, against attacks on it for abusing migrant labour. Also, a number of Carter’s cabinet members held high positions with IBM.
In line with the capitalist ‘internationalism’ of these corporations, Carter called for increased US investment in South Africa, and he is protecting US investments in mineral-rich Zaire by sending emergency aid to Mobutu. The free-trade policy of the multinationals is, though, putting Carter in a bind. Industries with foreign affiliates and with sizeable export markets oppose protectionism, while stagnant industries and the labour officialdom, with is social-democratic patriotism, are mounting a strong offensive for protectionism.
When it comes to labour, however, Carter is no longer faced with a choice between different interests within the ruling class Increasing productivity, keeping real wages at their level when the long decline started, and maintaining obstacles to organising the three-quarters of the labour force not in unions are objective shared by the administration and the rest of the ruling class.
Prices have risen 36% since the minimum wage was set at $2.31 per hour in 1972, yet Carter is proposing only a 9% rise to $2.50 per hour in response to the AFL-CIO request for a $3.00 minimum Carter did not lift a finger as the House of Representatives voted down a bill that would give construction workers the right to picket an entire building site when one of the building trades unions on the site is on strike. As governor of Georgia, Carter opposed the closed union shop. It seems clear that as president he will do nothing to help organised labour repeal so-called right-to-work laws that prohibit the closed shop. Union organising in the South has renewed labour interest in the repeal.
The Secretary of Labour, Ray Marshall, is spearheading the administration’s drive against immigrant labour. Carter’s immigrant programme is aimed at pushing immigrants out of the US. It would require identification cards for ‘alien looking’ workers. The encouragement of jingoism increases the fragmentation of the working class on racial lines that has thus far been a key factor in the lack of worker opposition to the employers’ offensive.
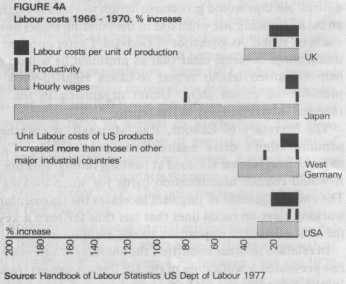
In relation to other countries, the employers’ offensive in the US has prevented a worsening of the US import-export trade balance. In the period from 1966–70, unit labour costs of US products increased more than those in other major industrial countries (see Figure 4(a)). This trend was reversed in the period 1970–74 when unit labour costs of US products increased less than those in other major industrial countries (see Figure 4(b)).
 |
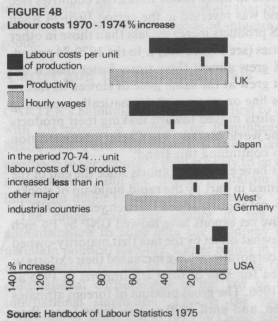 |
In the 1970–74 period, productivity in the US grew almost three times faster than it did elsewhere. Elsewhere it grew at the same pace or slowed its rate of growth. By holding the line on wages and dramatically increasing productivity, US capitalists moved toward making their products more competitive on the world market. The Carter administration is deeply committed to continuing this trend.
Nonetheless, imports have exceeded exports since the end of the recession. This is explained in part by the rapid build-up of stocks. Between 1956 and 1966, net exports added 1% each year to GNP. In the past two years, negative net exports have reduced GNP by 1% each year. This effect is somewhat offset by the fact that majority-owned foreign affiliates of US corporations have increased their exports to the US. They accounted for 32% of total US imports in 1975 as compared with 25% in 1966. The gross product of foreign affiliates was 6% of GNP in 1966, and until 1970 at least grew faster than domestic gross product. Profits from foreign affiliates represent an increasing proportion of total corporate profits. Between 1973 and 1976, net foreign profits were over 6% of total corporate profits; between 1966 and 1968 they were 3.5–4% of the total corporate profits.
Clearly the long decline has meant no retrenchment of foreign investment, which is already offsetting somewhat the domestic decline. And it is doing this despite the international character of the long decline. The Carter administration will dull somewhat more the sharp edge of stagnation in the US with renewed emphasis on the exploitation of workers in other countries through the multinationals.
THERE are differences in the ways the major sectors of the US working class are being affected by the stagnation of the economy. Factory operatives and non-farm labourers, clerical workers, and sales and service workers make up 22%, 17%, and 20%, respectively, of the labour force. Unemployment has been greatest among operatives and labourers. In 1976 the unemployment rates were 10.1% for operatives and 13.7% for labourers. The rate for clericals was 6.4%, and the rates for sales and service workers were 5.8% and 8.6%. The overall rate of unemployment was 7.7%. The sluggishness in capital spending together with the long-term relative growth in the clerical and sales-service labour market and relative decline in the operatives-labourers labour market account for these differences in the unemployment rates. The situation is reversed as regards wages. Keeping factory workers employed is expensive business; in December 1976 the manufacturing worker earned $220 per week, whereas the service worker earned only $151 per week. The average weekly earning was $182, which in real terms was just what workers made in 1969.
Black unemployment in 1976 was 13.1%, and black youth, 16–19 years old, were 37.1% unemployed, as compared with youth generally, who were 19% unemployed. Adult women were 7.4% unemployed, whereas 5.9% of adult men were unemployed.
The drastic cutbacks in urban services fill out the bleakness of this social picture. Many hospitals have curtailed services and schools can no longer offer the same breadth and level of instruction on reduced staffs. The crisis of indebtedness in New York City has forced many sacrifices on public employees. In February, Albert Shanker, head of the American Federation of Teachers described the sacrifices of New York City employees in his regular Sunday New York Times column: ‘During this period, all of our public employees have made substantial contributions to saving the city. They have deferred salary increases ...; they have lost 2.5% of their salaries by agreeing to replace city contributions to pensions with 2.5% of their own money; they have modified work rules to make for greater productivity; they have seen their workforce reduced by more than 53,000 in less than two years; and they are investing, by June 1978, $3.8 billion of their pension funds in city and Big MAC paper, compared to an investment of $1.4 billion by the banks.’ This is some indication of the cost in human terms to public employees of the national urban crisis. But it is also a shocking reminder of the craven posture of public-employee union leaders. Shanker and others have shown no willingness to fight back. Still, unemployment among public employees has not reached the high levels of unemployment among operatives and labourers in private industry. Public employee unemployment was 4.4% in 1976, whereas unemployment was 7.9% in manufacturing and 15.6% in construction.
The response of the working class to the employers’ offensive, which began in earnest in 1970, has been one of uneven militancy. There have been strikes and strike pressures in numerous industries. Yet the militancy does not generalise. Bonds of solidarity are not forged between workers striking in different industrial sectors or between strikers and other workers. Militancy in some areas spends itself in a single action and only in a few areas is there the rank and file organisation needed to sustain militancy beyond a single action.
The widespread militancy of forty years ago is not foreseeable. The great strike waves of 1934, 1937, and 1945 were actions of a working class under importantly different conditions. That working class had not yet been purged, by the reactionary pressures of the Cold War, of its left-wing elements. And it had not yet developed the illusion of perpetual prosperity under capitalism that was fostered by the post-World War II boom. The Minneapolis Teamster strike of 1934, the Little Steel strike of 1937, and the General Motors strike of 1945–46 were foci of the generalised militancy of those times. The need today is for a growth of solidarity, not just within the ‘blue-collar’ sector but also between it and the growing public employee, clerical, and sales-service sectors. This is indispensible for slowing the employers’ offensive and making clear the contradiction between increased invested capital and a return to high profit rates which it conceals.
National contracts will be negotiated this year in steel, mining, telephone and railroads. In steel, the Experimental Negotiating Agreement forbids an industry-wide strike when the contract expires in August. Still, strikes over local agreements may take place in several of the large mills that supported Ed Sadlowski, as a reform candidate, over Lloyd McBride for president of the 1.4 million member steelworkers union. McBride won handily in the industry as a whole. In mining, there has been continual wildcatting. Both the coal operators and the government want a union leadership that can discipline the ranks. Arnold Miller, who became president of the 125,000 member mineworkers union on a reform programme, is being challenged from the right for the presidency. There may be a new leadership trying to curb the miners’ traditional militancy when the contract expires in December.
In 1976, rank and file activists organised in the trucking industry. The results were that strikes were forced on Teamster officials in negotiating the Master Freight Agreement and in negotiating two agreements with the United Parcel Service. Electrical workers struck Westinghouse and there was a challenge to the leadership of their union, the IUE, based on rank and file resentment over secrecy in negotiations. This pattern of scattered militancy with the beginnings of rank and file organisation can be expected to continue through 1977. A further deepening of the long economic decline could, however, generalise the militancy and create the inter-industry solidarity that will be a more serious threat to the bosses than anything they face today.
The South is a land of run-away plants. Only 8% of the labour force is unionised in the Carolinas. In most of the South unionism declined between 1964 and 1974. There was surprise when the autoworkers won an election in a Louisiana headlight plant in December of 1976. They were making $2 per hour less than their brothers and sisters in an Indiana headlight plant. There were, though, defeats for the union in two other auto plants in the South in 1976. In North Carolina, the key to a successful organising drive is unionising the large textile industry. But J.P. Stevens textile workers in Roanoke Rapids have not been able to get a contract two years after winning a representation election. A national boycott of Stevens’ products is pressuring the corporation to recognise the union in all of its plants. Stevens employs 46,000 workers, and there are another 600,000 unorganised textile workers in the South.
Workers in the South have no alternative to unionisation. The employers’ offensive has made them super-exploited. Their battle will be violent but it is on its way. It could be one of the sparks that ignites a wider rank and file movement in the US.
1. A government deficit is the amount by which government spending overshoots its revenue from taxation, etc., which has to be financed by borrowing or printing money. Deficit spending is one the government can increase jobs and output during a recession.
2. Private investment includes the accumulation of stocks of goods that are not immediately sold, house building and the production of plant and equipment.
3. The Keynesian approach involves the government using tools like deficit spending and reductions in taxes and interest rates to stimulate economic activity and so even out the ‘business cycle’ of boom and slump characteristic of pre-war capitalism.
4. The rate of profit is the ratio of surplus-value to capital invested. To estimate surplus-value, what the capitalist calls before tax profits are added to net interest paid on debt. (A better estimate would also include rent and a large portion of managerial salaries). Invested capital includes not only fixed capital – plant and equipment – but also stocks of finished goods. Fixed capital is measured here by the difference between current dollar cost – the replacement value of the capital – and depreciation.
ISJ Index | Main Newspaper Index
Encyclopedia of Trotskyism | Marxists’ Internet Archive
Last updated on 30 March 2015