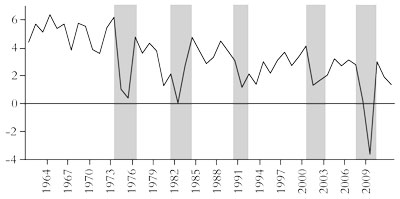
Figure 1: Real GDP growth (percentage year on year)
Source: OECD
ISJ 2 Index | Main Newspaper Index
Encyclopedia of Trotskyism | Marxists’ Internet Archive.
From International Socialism 2 : 140, Autumn 2013.
Copyright © International Socialism.
Copied with thanks from the International Socialism Website.
Marked up by Einde O’Callaghan for ETOL.
It is now six years since the first rumblings of the earthquake that was the global financial crash and the Great Recession. On 9 August 2007 BNP Paribas announced that it was closing down two of its funds of US mortgage backed securities and taking heavy losses. It was not long before other banks across the US and Europe announced similar losses. The stock market began to plunge from October 2007 (it had been faltering from March).
Then there was an avalanche of losses for banks globally. The US and the rest of the advanced capitalist economies then plunged into the Great Recession that lasted for 18 months from the beginning of 2008 to the middle of 2009.
This slump in capitalism has been called the Great Recession because it truly was “great”. As figure 1 shows, the slump in real GDP was larger than anything recorded since the Great Depression that started in 1929-30. And it spread across the globe even more widely than the Great Depression. [1]
|
Figure 1: Real GDP growth (percentage year on year)
|
World trade collapsed, unemployment rates rocketed and, most significant of all for capitalism, investment collapsed (see figure 2). Investment in real estate took an almighty plunge after the credit-fuelled boom up to 2007, but investment in productive assets also tumbled.
|
Figure 2: Investment in capital (percentage year on year) 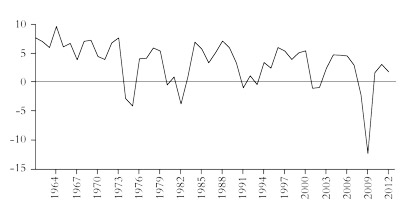
|
The mass of profits dropped like a stone, especially for the financial sector, which had appropriated huge shares of profit in the advanced economies from the 1990s up to 2007. In 2007 over 40 percent of US corporate profits went to the financial sector compared to just 10 percent in 1980. Now that share fell dramatically.
The financial sector was on its knees and rolling over. Because it had become such an important part of the capitalist system, particularly in the US, the UK and Europe, it now threatened to bring down the productive sector of capitalism through a string of bankruptcies and closures. Governments had to act. Their answer was to bail out the banks, mortgage lenders and insurance companies with government cash. This was partly raised by higher taxes on wage earners, but mostly by borrowing, in other words by selling government bonds to state pension funds and the very banks and insurance companies in trouble.
Sure, some banks were allowed to go bust (Bear Stearns, Lehman Brothers), but most were bailed out. In particular, AIG, the global insurance company, which had been insuring all the banks and hedge fund speculators against any losses on their speculations in derivatives of mortgage bonds and other “innovatory” forms of fictitious capital, received a massive handout. This was intended to meet in full the insurance claims on losses on speculative investments made by the likes of Goldman Sachs, etc. So the taxpayer ended up fully compensating the big banks for the losses they incurred from their own recklessness and greed. [2]
The finance sector had borrowed in order to lend to households to fuel the property bubble in the US and in Europe. [3] When that bubble burst, banks got deep into trouble and their debts had to be covered by the state. The banks could then deleverage their worthless assets at the expense of taxpayers, while households defaulted on their mortgages. So it was from households to banks to government; passing the parcel of debt.
Government debt rocketed to levels not seen since the Second World War-and not just in a few countries but everywhere. Figure 3 shows how public debt took off after the credit crunch and Great Recession. The taxpayer, in particular wage earners, now faced a massive bill in terms of increased debt servicing payments to bondholders (banks, etc) for the foreseeable future. Annual government budget deficits raced upwards in order to fund the bailouts, but also because as economies contracted sharply and unemployment spiralled, tax revenues dropped away and spending on welfare benefits mushroomed.
|
Figure 3: Sovereign debt among advanced economies 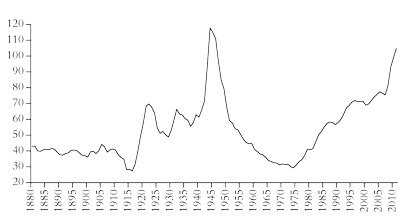
|
Pro-capitalist governments were determined that these deficits were brought down and the new debt reduced in size. So, as soon as the Great Recession ended, they embarked on what we now call programmes of “austerity” that aim to slash government spending, particularly government services, staff, investment and welfare; to raise taxes on wage earners in various forms; and to reduce the cost of state pensions by extending the retirement age, lengthening the time of service and raising the rate of contributions. [4]
For the Keynesians, whether of the “animal spirits” school or the financial instability school (Minsky), [5] the flaws of capitalism lie in the financial sector only. In contrast, Marx posits the ultimate cause of capitalist crises in the capitalist production process, specifically in production for profit. He developed a theory of crises based on his law of the tendency of the rate of profit to fall over time as capitalists accumulate.
In short, this law goes: as capitalism develops, the amount of constant capital (the stock of investment in equipment, plant and technology) tends to rise in relation to variable capital (investment in the wages of the workforce employed). Because labour power purchased with variable capital (wages) is the only part of capital that produces surplus value, the amount of surplus value falls relative to the total cost of the stock of investment for the capitalists. The rate of profit falls. This tendency, as Marx called it, can be counteracted. There are many counteracting factors (a fast-rising rate of surplus value or a significant cheapening of the means of production are the most important ones), but Marx shows that the law “as such” (the tendency) will eventually overcome those counteracting factors. The rate of profit in an economy will eventually fall and a production crisis will eventually happen. [6]
That does not mean the financial sector and, in particular, the size and movement of credit do not play any role in capitalist crisis. On the contrary, the growth of credit and fictitious capital (Marx’s term for speculative investments in stocks, bonds and other forms of financial assets) picks up precisely in order to compensate for the downward pressure on profitability in the accumulation of real capital.
The US rate of profit shows a secular downtrend from 1947 right up to 2011. From 1947 to 65, there was high profitability which, although falling in the 1950s, stabilised through the mid-1960s. Then the US economy entered a down phase in profitability, a period of crisis, eventually to hit a low in the deep recession of the early 1980s. After that profitability rose, not back to the level of the 1960s, but still significantly. This was the so-called neoliberal era. Profitability peaked in 1997 and in that sense the neoliberal era came to an end in the late 1990s, although there was another burst in profitability in the early 2000s, driven by the credit boom.
We can sum up the movement in the US rate of profit by measuring the change in the rate across different phases. Between 1947 and 2011 the US rate of profit fell by over 30 percent. Most of that fall was in 1965-82, when it fell by over 20 percent. Then there was a recovery in the rate of nearly 20 percent from 1982 to 1997. Since then the rate has fallen about 9 percent (so far), only half the rate of the previous downphase. [7] Figure 4 shows that, with profitability declining after 2005, the huge expansion of fictitious capital could not be sustained by the (falling) rate of profit in the real economy. Eventually the housing and financial sectors (the most unproductive parts of capitalist investment) stopped booming and reversed.
|
Figure 4: G7 rate of profit and credit (public and private) 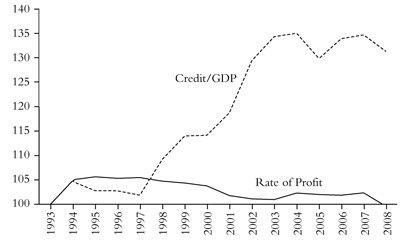
|
Indeed, the tendency of the rate of profit to fall promotes speculation in property, credit and stock markets. If capitalists cannot make enough profit-producing commodities they will try making money betting on the stock exchange or buying various other financial instruments, or by buying property. Capitalists experience the falling rate of profit almost simultaneously, so they all start to buy these stocks and assets at the same time, driving prices up.
The flight of money to the financial and speculative sectors of the economy is really a “countertendency” response to the falling rate of profit in the productive sectors. A higher rate of profit can be generated for a while in these unproductive sectors, helped by the monetary authorities keeping the basic rate of interest low and stimulating credit. When stocks and asset prices are rising, everybody wants to buy them so the bubble expands. But sooner or later bubbles burst when investors realise that the assets are not worth what they are paying for them. And with the level of debt already created, the collapse is just that much worse.
The basic problem is still the fallen rate of profit, which depresses investment demand (see figure 5). If the underlying economy was healthy, an imploding credit bubble need not cause a crisis, or at least need only cause a short one, an example being the 1987 stock market crash where a stock market bubble burst without an ensuing production crisis. If the total economy is healthy and the rate of profit is high, the revenue generated from interest payments on loans will, in one way or another, be reinvested in production.
|
Figure 5: US investment and profits ($ billions)
|
An artificial and temporary inflation of profits in the unproductive sectors helps sustain the capitalist economy and resist the impact of a falling rate of profit in the productive sectors. But an increasing share of debtors who cannot finance their debt eventually causes default and the crisis erupts in the financial sector. [8] Under capitalism, a slump is necessary to correct and reverse the falling rate and mass of profit. [9]
Some Marxists have argued that the credit crunch of 2007 and the ensuing Great Recession is not a classical Marxist crisis of profitability and that Marx would have also seen the crisis as financial in cause. [10] But the empirical evidence supports the view that it was a profitability crisis à la Marx’s law. The rate of profit in the US economy began to fall well before the financial crisis began in summer 2007. The rate of profit calculated in Marxist terms actually peaked in 2005 at 24.8 percent and fell by 3 percentage points to trough in 2008–9. The mass of corporate profit (pre-tax adjusted) peaked in Q3’06 (the third quarter of 2006) at $1,655 billion, falling 32 percent to a trough of $1,124 billion in Q4’08, before recovering. Similarly, financial sector domestic profits peaked at $447 billion in Q2’06 and dropped by 73 percent to a trough of $122 billion in Q4’08! But non-financial sector domestic profits also plummeted, peaking in Q3’06 at $988 billion and then falling to $629 billion in Q1’09 – a drop of 36 percent. Any way you want to measure it, profitability and/or the mass of profits fell well before the financial crisis began. [11] So “excessive credit”, stock market speculation and the expansion of fictitious capital in all its new and exotic forms were a response to falling profitability in the productive sectors of the economy. It delayed the inevitable, but eventually made the crisis deeper and longer as a result.
Some argue that the crisis was the product of a brand new development in capitalism: the globalisation of finance capital and its now overwhelming dominance of the capitalist economy. Crises can now take place in that sector alone and cause economic recession. They argue that Marx’s law of profitability is no longer relevant. But financial globalisation is nothing new: in 1875 banker Karl von Rothschild assigned the banking collapse then to “the whole word becoming a city”. The interdependence of stock markets and credit with the “real” economy is not new. [12]
It’s true that the share of US gross domestic income accruing to finance and insurance rose dramatically from 2.3 percent in 1947 to 7.9 percent in 2006. But can we say that the growth of the financial sector was the cause of the Great Recession if it had been expanding for six decades without a crisis of the proportions of 2008?
Since the trough of 2009 in the Great Recession the major capitalist economies have experienced the weakest recovery of all compared to previous ones from other slumps. The length of recovery since the trough of the Great Recession in mid-2009 to a point when the former rate of economic growth before the slump is restored has been three times as long as in any other previous post-war recession, at least in the US. Indeed, the previous growth rate has still not been restored (table 1). The recovery of growth rates looks more like a square root sign than the more usual V-shape or even the L-shape seen in Japan in the 1990s. [13]
|
Table 1: US Recovery lengths after recession |
|||
|
Peak |
Trough |
Recovery Date |
Recovery Length |
|
1948 q4 |
1949 q4 |
1950 q4 |
4 |
|
1953 q3 |
1954 q2 |
1955 q3 |
5 |
|
1957 q3 |
1958 q2 |
1959 q2 |
4 |
|
1960 q2 |
1961 q1 |
1962 q1 |
4 |
|
1969 q4 |
1970 q4 |
1971 q3 |
3 |
|
1973 q4 |
1975 q1 |
1976 q3 |
6 |
|
1980 q1 |
1980 q3 |
– |
– |
|
1981 q3 |
1982 q4 |
1983 q5 |
5 |
|
1990 q3 |
1991 q1 |
1992 q3 |
6 |
|
2001 q1 |
2001 q4 |
– |
– |
|
2007 q4 |
2009 q2 |
Ongoing |
16 |
Moreover, the loss of GDP suffered in the US economy can be measured as the difference between the amount of GDP that would have been generated if the rate of economic growth had continued through 2008 to now, and what actually happened. In the Great Recession and in the subsequent weak recovery, over 22 percent of US GDP has been lost forever, and still counting-way more than the loss in the next worst double-dip recession of 1980–2 (table 2).
|
Table 2: Cost of recessions and recoveries in the US |
|||
|
|
Recession |
Recovery |
Total |
|
1948 q4 |
4.29 |
2.56 |
6.84 |
|
1953 q3 |
4.07 |
3.16 |
7.23 |
|
1957 q3 |
3.3 |
2.6 |
5.9 |
|
1960 q2 |
2.12 |
1.46 |
3.58 |
|
1969 q4 |
1.07 |
1 |
2.08 |
|
1973 q4 |
04.75 |
4.48 |
9.23 |
|
1980 q1 |
02.05 |
2.73* |
4.78* |
|
1981 q3 |
8.65 |
3.07 |
11.72 |
|
1990 q3 |
1.27 |
02.89 |
4.15 |
|
2001 q1 |
– |
– |
– |
|
2007 q4 |
5.54 |
16.57 |
22.1 |
|
* The 1980 recovery is an unfinished recovery so costs are not comparable to the other recessions. |
|||
In most cases a recession or slump eventually reduces the costs of production and devalues capital sufficiently to drive up profitability for those capitalist enterprises still standing. That is the “purpose” of a slump under capitalism. Unemployment drives down labour costs and bankruptcies and takeovers reduce capital costs. Businesses then gradually start to increase production again, and eventually begin to invest in new capital and rehire those in what Marx called the “reserve army of labour” without a job. This boosts demand for investment goods and eventually workers start buying more consumer goods and recovery gets under way.
But this time things are different. Such is the overhang of spare capacity in industry and construction and such is the level still of debt owed by businesses, government and households alike that this recovery has been stunted. Overcapacity in industry remains much higher than after previous recessions (figure 6). As we’ll see in more detail below, profitability is going to have to rise some way before new investment will be considered.
|
Figure 6: Percentage capital utilisation 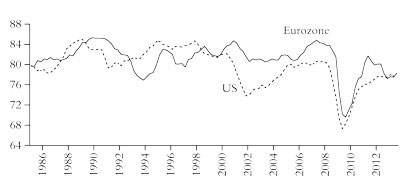
|
After a reasonable recovery in 2010 the major capitalist economies have slowed to under 2 percent growth pace, with the US economy currently growing at 1.4 percent year on year, the Eurozone in negative growth and UK growth barely above zero. Even the so-called emerging capitalist economies have slowed in the last year. The world economy is growing in real terms by barely above 3 percent a year. When you take into account population growth global per capita GDP growth is below 2 percent (figure 7).
|
Figure 7: Annual percentage growth in GDP per capita 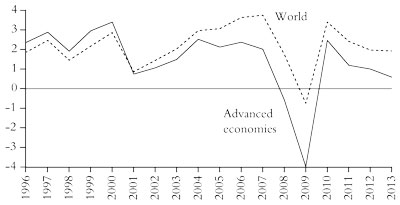
|
In recent months stock markets around the world have headed towards new highs. Does this mean that at last the major capitalist economies are beginning a period of sustained employment-creating growth? Not really.
The US capitalist economy has performed the best since the trough of the Great Recession in mid-2009. But even there US real GDP growth has been poor. In the first half of 2013 real GDP growth was just 1.4 percent over the previous year, while unemployment remains at 7.8 percent, well above the level before the slump. Most significant is that the US labour force is shrinking as a proportion of those adults of working age (figure 8). “The reserve army of labour” has grown sharply during the Great Recession and after and shows no sign of reversing.
|
Figure 8: US Labour force participation rate 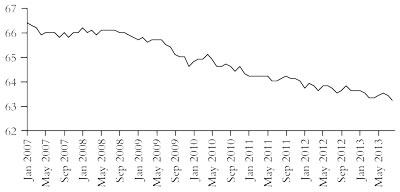
|
The UK economy picked up a little in the second quarter of 2013, but only after flat-lining for several quarters. Real GDP growth this year will be little more than 1 percent. The Eurozone finally lifted itself out of recession in the second quarter, but compared to last year, real GDP is still some 0.7 percent lower. And all the economic expansion is concentrated in the so-called core northern European economies, mainly Germany. In the peripheral southern European economies an outright depression continues, with Italy’s economy contracting by 2 percent, Spain by 1.5 percent, Portugal by 2.3 percent and, of course, Greece by 5 percent. Even growth in Ireland, the poster child of the “success” of austerity policies, has slowed to a trickle after a short recovery. [14]
Yet austerity is still the message. [15] Why? Well, because “the old model doesn’t work any more”, namely traditional Keynesian efforts to boost demand by encouraging spending. [16] The aim of austerity is not just to reduce public debt and government spending as such, but to restore the profitability of the capitalist sector. As European Central Bank (ECB) president Mario Draghi puts it, “that’s why structural reforms are so important, because the short-term contraction will be succeeded by long-term sustainable growth only if these reforms are in place.” And that’s why when the euro leaders relaxed the pace of austerity for several governments, they did so on the condition that “supply-side reform” was stepped up, namely by cuts in job security, wage levels, pensions and “protected” industries along with more privatisation. That is the real aim of austerity: more neoliberal policies to restore the capitalist sector.
But is austerity working to achieve this? Recently JP Morgan economists put together some measures of progress: the amount of deleveraging achieved in public and private sector debt; more competitive prices for trade by the distressed states; making it easier to hire and fire employees; opening up “markets”; more privatisations and, interestingly, progress on reducing democratic and constitutional obstacles in various states to imposing neoliberal policies. J.P. Morgan concluded that the Eurozone was only halfway there in this neoliberal recovery programme. [17] On the fiscal austerity targets, Italy was 75 percent on the way, Spain just 38 percent, Greece 97 percent, Ireland just 26 percent and Portugal 55 percent.
Importantly, wage cuts and reductions in labour costs had gone further, with Ireland and Portugal having done enough, Greece a little further to go (after a 30 percent cut in living standards!) and Spain still another 25 percent to go.
But when it came to “structural reform”, ie reducing the size of the public sector, selling off state assets, reducing labour and pension rights, lower corporate taxes, etc, progress had been much slower. Apparently, Italy, Greece, Spain and Portugal were still much less oriented to allowing the capitalist sector free rein than the likes of the Netherlands or Ireland.
The euro project was unique in one way. It was designed to achieve integration and convergence among various European capitalist states, but without establishing a full federal union of Europe, with one government, one budget, one set of tax laws and one banking system. For a while it seemed to work-until the crisis came, although even in the boom years there was more divergence than convergence.
Can the euro’s halfway house now survive? It is not heading towards some federal union of European states, whatever the claims of the nationalist sceptics of UKIP or the Front National. A “United States of Europe” under capitalism is not on the agenda. The halfway house could lumber on if economic growth returns. But growth depends on investment. And investment has collapsed and not just in the weaker capitalist economies of the Eurozone. Since 2007 investment has risen in only one of the 17 countries (Luxembourg).
The issue of external competitiveness is less important. For the seven countries whose 2012 GDP was higher than in 2007, net exports made a big difference in only three cases; of the ten countries where GDP declined, net trade made a material contribution in seven, but this was not enough to offset the decline in investment. In other words, the problem for the weaker euro capitalist states is not external competitiveness, but investment-it’s a very conventional capitalist crisis.
Overall, world GDP growth remains modest at best, with the average real growth rate well below that before the crisis (figure 9).
|
Figure 9: Global manufacturing purchasing managers’ index (PMI) 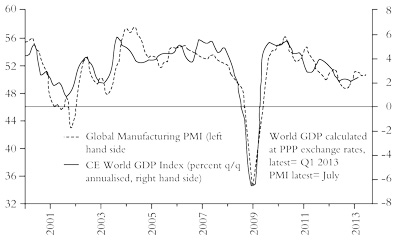
|
This weak “square root” recovery or Long Depression is the product of two factors, the failure of profitability to recover to pre-crisis levels, let alone to the higher peak levels of the mid-1990s, in the major economies and the weight of excessive debt on investment and profit that must be reduced before profitability and investment can recover on a sustained basis.
JP Morgan economists have recently made a study of global corporate profitability. [18] They concluded that what they call “profit margins” have fallen in Europe and in emerging economies over the past two years. They also concluded that US profitability has stagnated over the last six quarters, on their measure. JP Morgan’s measure of profitability is not a Marxist one and it is not even a measure of corporate profits against corporate capital. But even so, it does produce a global measure of corporate profitability that shows a fall from near 9 percent before the Great Recession down to 4 percent in the trough of 2009 before recovering to 8 percent in 2011. But in 2012 it declined again to 7 percent, 13 percent below its peak in February 2008 when the Great Recession began. This decline in global profitability is driven by Europe and by a fall in emerging economies (figure 10).
|
Figure 10: Global profit margins 
|
Similarly, profitability has not recovered as measured by the EU AMECO and US data and indexed from 2005 (figure 11). [19]
|
Figure 11: Net return on capital (indexed 2005 = 100) 
|
The EU Commission has also commented on corporate profitability and investment in Europe. In its Winter Economic Forecast report it noted that non-residential investment (that excludes households buying houses) as a share of GDP “stands at its lowest level since the mid-1990s”. And the main reason: “a reduced level of profitability”. The report makes the key point that “measures of corporate profits tend to be closely correlated with investment growth”. Only companies that don’t need to borrow and are cash-rich can invest-and even they are reluctant. The commission found that Europe’s profitability “has remained below pre-crisis levels”. [20]
Sure, in the US, the total level of profits has surpassed the previous pre-crisis peak, but not the rate of profit. And in many other advanced capitalist economies even the mass of profit has not reached the previous peak. We don’t have to look for uncertain and “unexpected negative shocks” or “government interference in the market’s pricing of labour and capital” to explain the stagnation. There just ain’t enough profit to get capitalists to invest at previous levels.
The EU Commission found a “strong negative correlation between changes in investment since the onset of the crisis and pre-crisis debt accumulation, suggesting that the build-up of deleveraging pressures has been an important factor behind investment weakness”. The commission reckons that Eurozone corporations must deleverage further by an amount equivalent to 12 percent of GDP and that such an adjustment spread over five years would reduce corporate investment by a cumulative 1.6 percent of GDP. Given that non-residential investment to GDP is at a low of 12 percent right now, that’s a sizeable hit to investment growth.
These studies support the view that capitalism is in a Long Depression similar to the period after 1873 in the UK and the US that lasted until the 1890s (or at least the mid to late 1880s)-then called the Great Depression. And like the 1930s Great Depression, which lasted from 1929 until the Second World War. Both periods had years of recovery, even sharp recovery, but they did not establish sustained growth periods and suffered more and deeper slumps until the rate of profit recovered sufficiently. [21] Sustained growth came back from the 1890s in the UK and particularly the US until 1910. Sustained growth also came back in the “golden age” of 1946-65 after the Second World War. But such a new “boom” period still seems some time away right now.
Indeed, the profitability of the accumulated capital in the major economies has been in secular decline and has not been restored to the level reached before the Great Recession of 2008-9. While the world average (defined here as G7 + BRICS) has been higher since the early 1980s and has held up more or less since the mid-1990s, the G7 rate has fallen back [22] (figure 12).
|
Figure 12: A world rate of profit (index 100 = 1963) 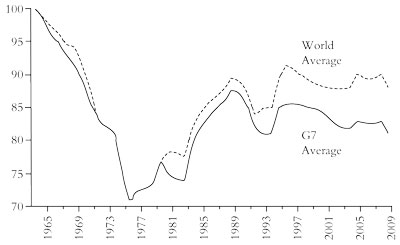
|
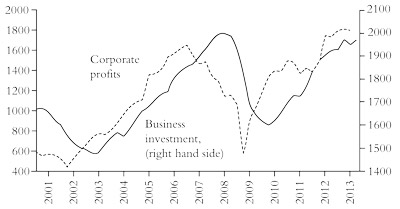
Some strategists of capital and Keynesian economists have been puzzled by the huge build-up in cash reserves by corporations in the US and Europe. If profits are up and cash is plentiful, why is corporate investment so pitiful? [23] Well, cash flow and profits may be up for larger companies, but the rate of profit has not recovered in many capitalist economies, like the UK and Europe. Just look at the situation in the UK-corporate profitability remains well below pre-crisis levels and consequently, so does business investment (figure 13).
|
Figure 13: UK rate of profit and business investment 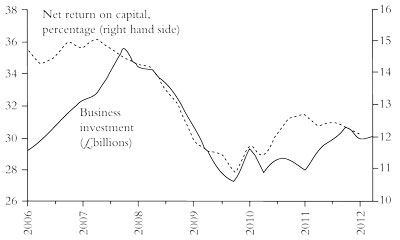
|
Also large multinationals have preferred to invest in emerging economies rather than in the domestic economy. And cash-rich companies have taken advantage of credit-fuelled stock markets provided by quantitative easing to buy back their own shares rather than invest and boost dividends. This helps executive bonuses! Small businesses cannot invest because they cannot borrow on current terms and many are zombie companies just able to pay the interest on their debt. They have been hoarding labour rather than investing in new equipment and labour saving systems. And overall corporate debt levels remain too high to allow new investment-paying down debt or holding cash is safer.
The conundrum of rising profits and stagnant investment in productive assets shows that the “recovery” is artificial. It depends on central bank liquidity, which finds its way into the financial sector, not the real economy. The really cash rich companies are banks, financial institutions and large multinationals and not the bulk of non-financial companies that invest and employ labour. Central banks’ policy of quantitative easing (QE)-buying government and corporate bonds by “printing” money-is not delivering a sustained economic recovery, as the Keynesians expected. So the strategists of capital are trying to combine QE with more “structural reform”; Keynesian monetary policies with neoliberal action to cut debts, shrink the welfare system and weaken the power of organised labour, thus raising the rate of exploitation to restore profitability. This was the line that IMF boss Christine Lagarde spelt out at her speech in the US Federal Reserve’s August annual summer symposium at Jackson Hole, Wyoming. [24]
That leads to the second reason for the depression. The recovery after the great slump has been hampered and curbed by the dead weight of excessive debt built up in the so-called neoliberal period after the early 1980s and particularly during the credit and property bubble from 2002 (figure 14). The level of debt in the world economy has not fallen much despite the Great Recession, the banking crash and bailouts. Deleveraging has much further to go.
|
Figure 14: Financial profits (left hand side) and total debt. 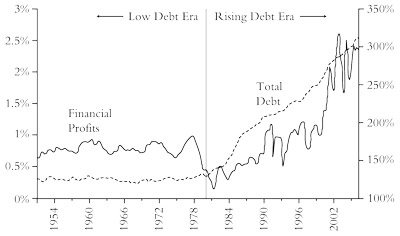
|
Indeed, developed economy non-financial sector leverage continues to rise. [25] Non-financial sector debt in the US, Europe and Japan (the “G3”) is now over 285 percent of GDP compared to 275 percent at the start of the Great Recession (figure 15).
|
Figure 15: Non-financial debt/GDP – Japan, US and Europe 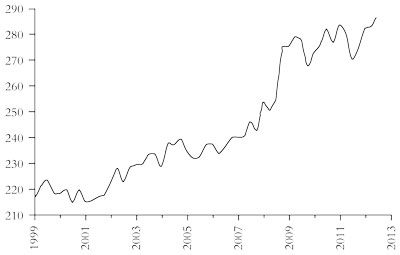
|
Business debt to GDP has fallen a little and in some countries like the US, so has household debt. Financial sector debt has fallen too, by 20 percent from its peak. But if we add up all debt-non-financial and financial-in the G3, it fell from 409 percent of GDP to 379 percent of GDP in September 2011, but has now risen back to 400 percent-so not much deleveraging there.
The US is the only economy that has seen any deleveraging (see figure 16)-and that largely reflects mortgage defaults in the household sector. Credit has not declined noticeably in non-US countries and only declined gradually in the US. [26]
|
Figure 16: Credit to GDP in the private sector, US and 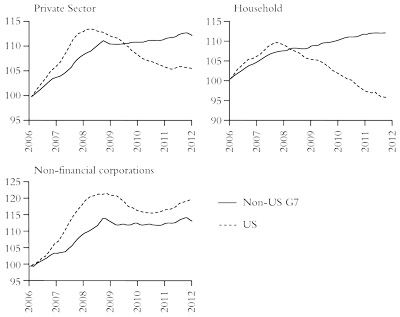
|
A new slump will be necessary to “cleanse” the capitalist economy of too much debt and too many inefficient “zombie” companies. The right wing London financial daily, City AM, described the problem in the UK economy: “an army of zombie firms remain addicted to near-zero interest rates, forcing down productivity and preventing a Schumpeterian process of creative destruction and reallocation of capital and labour.” A large proportion of small and medium-sized UK companies have become zombie-like, only generating revenues sufficient to maintain the labour force and pay interest on their debt, but not enough to deleverage or invest. [27] The productivity of small firms has plunged (figure 17).
|
Figure 17: Zombie companies? UK productivity 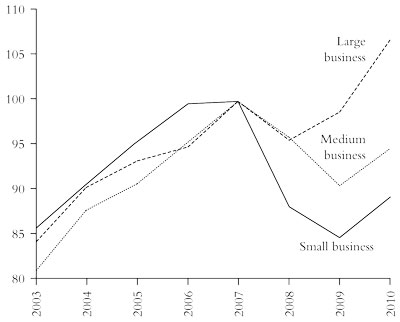
|
One analyst reckons that as interest rates start to rise over the next year, when central banks try to wean the capitalist sector off its milk of “easy money” that has until now been “slowing down the process of creative destruction”, “these zombie companies are going to present symptoms of a disease which will begin to affect other companies. That is when the recession will come”. [28]
So the current low-growth world is partly a reflection of the burden of still high debt levels on the cost of borrowing relative to potential return on capital and thus on growth. The job of a slump (to devalue assets, both tangible and fictitious) has not yet been achieved. And if interest rates should start to rise, that could easily trigger a new slump as the cost of servicing corporate and government debt would rise to unsustainable levels.
How much more deleveraging is necessary? Global liquidity as a share of world GDP took off in the credit bubble that began in the mid-1990s. [29] After the credit crunch and the Great Recession, liquidating all that fictitious capital has been slowly under way. Global liquidity to GDP remains some 11 percent above the pre credit bubble trend line (figure 18). At current rates, to get rid of the remaining excess fictitious capital will take at least until 2015-and then it may only be achieved by a new global slump in production.
|
Figure 18: Global liquidity as percentage of GDP 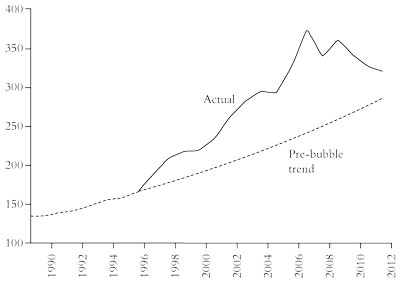
|
As the leading global bond investment manager, PIMCO, put it in a monthly report to investors:
Statistically speaking, the global economy experiences a recession every six years or so, and the frequency of global recessions tends to increase when global indebtedness is high and falling as opposed to when indebtedness is low and rising. Given that the last global recession was four years ago and also given that the global economy is significantly more indebted today than it was four years ago, we believe there is now a greater than 60 percent probability that we will experience another global recession in the next three to five years. [30]
1. See Roberts, 2009, and Bacchetta and Van Wincoop, 2013.
2. See Barofsky, 2012.
3. Northern Rock was a small mortgage lender based in the north east of England. Taking on joint stock status, it engaged in aggressive mortgage lending, relying on the interbank loan market for its funding. When the credit crunch came, it was frozen out of credit markets and collapsed. It did not fall apart because it bought large mortgage-backed assets from US institutions but because it borrowed to participate in the property boom. The UK taxpayer had to take it over to avoid a run on the banks. For the Northern Rock story, see Roberts, 2009, chapter 27.
4. Pensions are really deferred wages, as social security contributions are deductions from gross wages extracted by the state. So the reduction in the value of state and other pensions is another form of making workers pay for the Great Recession.
5. For an analysis of the defects of Keynesian and post-Keynesian analysis of capitalist crises, see Roberts, 2010.
6. For a more detailed account and defence of Marx’s law, see Carchedi and Roberts, 2013b (forthcoming).
7. See Roberts, 2011, and 2012, and Carchedi and Roberts, 2013a.
8. See Carchedi, 2011: “The basic point is that financial crises are caused by the shrinking productive base of the economy. A point is thus reached at which there has to be a sudden and massive deflation in the financial and speculative sectors. Even though it looks as though the crisis has been generated in these sectors, the ultimate cause resides in the productive sphere and the attendant falling rate of profit in this sphere.”
9. “The periodical depreciation of existing capital-one of the means immanent in capitalist production to check the fall of the rate of profit and hasten accumulation of capital-value through formation of new capital-disturbs the given conditions within which the process of circulation and reproduction of capital takes place, and is therefore accompanied by sudden stoppages and crises in the production process” – Marx, 1981, p. 358.
10. For example, Duménil and Lévy, 2011.
11. See Tapia Granados, 2012, Izqiuerdo, 2010, Carchedi and Roberts, 2013a and Carchedi (unpublished) for more evidence that profitability was the cause.
12. For a critique of financialisation theories, see Mateo, 2011.
13. This “square root” recovery is something predicted in Roberts, 2009: “The big fall in output is over. Now there will be an upturn. But it will fall short of restoring the rate of economic growth achieved before the Great Recession.”
14. See Roberts, 2013b, for the story of the so-called “success of austerity” in Ireland and the Baltic states.
15. ECB president Mario Draghi maintains: “There was no alternative to fiscal consolidation, even though we should not deny that this is contractionary in the short term. In the future there will be the so-called confidence channel, which will reactivate growth; but it’s not something that happens immediately”. Clearly not!
16. Christian Noyer, governor of the Bank of France, echoed Draghi in saying that austerity was necessary to encourage the “confidence fairy” to make an appearance: “Over a certain threshold, which our country has probably crossed, any increase in public spending and debt has extremely negative effects on confidence.” In other words, recovery is possible only if capitalists become confident that it will happen and that apparently depends on getting budget deficits and debt down. Noyer added that France had to move away from public policies “overly concerned with preserving the jobs of the past” and allow for “liberalisation” that could help future job creation.
17. J.P. Morgan, 2013b.
18. J.P. Morgan, 2013a,
19. See Roberts, 2013a.
20. European Commission, 2013, pp. 18–21.
21. See Roberts, 2009, chapter 13, on the UK rate of profit during late 19th century and Roberts blog for the rate of profit in the US during the Great Depression, http://thenextrecession.wordpress.com/2012/08/06/the-great-depression-and-the-war/.
22. Roberts, 2012.
23. Robin Harding, Corporate investment: a mysterious divergence, http://tinyurl.com/p4tvblv.
24. “I do worry that all the hard work of central banks will be wasted if not enough is done on other fronts-to adopt the admittedly more difficult policies needed for balanced, durable, and inclusive growth ... [unconventional monetary policy] is providing the space for more reforms. We should use that space wisely” – Lagarde, 25 August 2013.
25. According to Gerard Minack of the investment bank Morgan Stanley (“if it can’t happen, it won’t happen”). Non-financial sector debt includes all debt held by governments, households and corporations. It excludes financial sector debt.
26. Bacchetta and Van Wincoop, 2013.
27. One in ten British businesses are able only to pay interest on their debts and not reduce the debt. “Zombie companies cannot invest or innovate, they just sit there slowly losing employees and customers and dragging on the economy,” according to KKR asset management.
28. Go to http://angrybearblog.com/2013/08/zombie-companies-live.html.
29. Global liquidity is measured by the amount of bank loans, securitised debt and derivatives in the world. See Roche and McKee, 2009.
30. http://www.pimco.com/EN/Insights/Pages/Secular-View-of-Assets-2013.aspx.
Bacchetta, Philippe, and Eric Van Wincoop, 2013, Explaining the Global Great Recession (27 June 2013), www.voxeu.org.
Barofsky, Neil, 2012, Bailout: An Inside Account of how Washington Abandoned Main Street while Rescuing Wall Street (Free Press).
Carchedi, Guglielmo, 2010, Behind the Crisis (Brill).
Carchedi, Guglielmo, 2011, Behind and Beyond the Crisis, International Socialism 132 (winter 2011), www.isj.org.uk/?id=761.
Carchedi, Guglielmo, unpublished paper, Marx’s Law and the Crisis: An Empirical Study.
Carchedi, Guglielmo, and Michael Roberts, 2013a, The long roots of the present crisis: Keynesians, Austerians and Marx’s law, World Review of Political Economy, volume 4, number 1, pp 86–115.
Carchedi, Guglielmo, and Michael Roberts, 2013b, A Critique of Michael Heinrich, Monthly Review (forthcoming).
Duménil, Gérard, and Dominique Lévy, 2011, The Crisis of the 21st Century: General Interpretation, Recent Developments and Perspectives, www.jourdan.ens.fr/levy/dle2011h.htm.
European Commission, 2013, Winter 2013 Economic Forecast, http://ec.europa.eu/economy_finance/publications/european_economy/2013/pdf/ee1_en.pdf.
Fatas Antonio, and Ilian Mihov, 2013, From recession to normalcy, CEPR discussion paper, DP9551, www.voxeu.org/article/recoveries-missing-third-phase-business-cycle.
Izquierdo, Sergio Cámara, 2010, Short and Long Term Dynamics of the US Rate of Profit in the Context of the Current Crisis, paper at the Congrès Marx International VI.
J.P. Morgan, 2013a, Corporate Profitability, (February 2013).
J.P. Morgan, 2013b, The Euro Area Adjustment, About Halfway There (28 May 2013), http://tinyurl.com/ooawnxv.
Marx, Karl, 1981, Capital, Volume 3 (Penguin), www.marxists.org/archive/marx/works/1894-c3/ch15.htm.
Mateo, Juan, 2011. The Financialization as a Theory of Crisis in a Historical Perspective: Nothing New Under the Sun, Working Paper Series Number 262 (July 2011), Political Economy Research Institute, University of Massachusetts, Amherst. http://tinyurl.com/phrveqc.
Roberts, Michael, 2009, The Great Recession: Profit Cycles, Economic Crisis – A Marxist View, www.lulu.com.
Roberts, Michael, 2010, The Causes of the Great Recession: Mainstream and Heterodox Interpretations and the Cherry Pickers, paper at the Tenth Conference of the Association of Heterodox Economists.
Roberts, Michael, 2011, Measuring the Rate of Profit, Profit Cycles and the Next Recession, paper to the Eleventh Conference of the Association of Heterodox Economists.
Roberts, Michael, 2012, A World Rate of Profit, paper to the WAPE/AHE/IIPPE conference.
Roberts, Michael, 2013a, The euro crisis is a crisis of capitalism, lecture to the Institute of labour Studies, Slovenia, 2013, http://tinyurl.com/pgvk37z.
Roberts, Michael, 2013b, What’s Wrong with the Keynesian Answer to Austerity?, Socialist Review (April 2013).
Roberts, Michael, 2013c, Deleveraging and Profitability again (25 February 2013), http://gesd.free.fr/mr132.pdf.
Roche, David, and Robert McKee, 2009, New Monetarism, www.lulu.com.
Tapia Granados, José, 2012, Does Investment Call the Tune? Empirical Evidence and Endogenous Theories of the Business Cycle, http://tinyurl.com/pohwwnv.
ISJ 2 Index | Main Newspaper Index
Encyclopedia of Trotskyism | Marxists’ Internet Archive
Last updated on 27 April 2022