We have noted above that to judge the development of large-scale industry from factory statistics it is necessary to separate the relatively useful material in these statistics from the utterly useless. Let us, with this in view, examine the main branches of our manufacturing industry.
At the head of the wool trades is cloth production, which in 1890 had an output of over 35 million rubles and employed 45,000 workers. The historico-statistical data on this trade indicate a considerable drop in the number of workers, namely, from 72,638 in 1866 to 46,740 in 1890.[1] To appraise this phenomenon we must take account of the fact that up to the 1860s inclusive, felt cloth production was organised on specific and original lines: it was concentrated in relatively large establishments which, however, did not in any way come under the category of capitalist factory industry, since they were based on the labour of serfs, or of temporarily bound peasants. In the surveys of the “factory” industry of the 60s we therefore meet with the division of cloth mills into 1) those owned by landlords or nobles, and 2) those owned by merchants. The former produced mainly army cloth, the government contracts having been distributed equally among the mills in proportion to the number of machines. Compulsory labour was the cause of the technical backwardness of such establishments and of their employing a much larger number of workers than the merchant mills based on the employment of hired labour.[2] The principal drop in the number of workers, engaged in felt cloth production took place in the gubernias with landlord factories; thus, in the 13 such gubernias (enumerated in the Survey of Manufactory Industries ), the number of workers dropped from 32,921 to 14,539 (1866 and 1890), while in the 5 gubernias with merchant factories (Moscow, Grodno, Liflandia, Chernigov and St. Petersburg) it dropped from 31,291 to 28,257. From this it is clear that we have here two opposite trends, both of which, however, indicate the development of capitalism—on the one hand, the decline of landlord establishments of a manorial-possessional character,[35] and on the other, the development of purely capitalist factories out of merchant establishments. A considerable number of the workers employed in felt cloth production in the 60s were not factory workers at all in the strict sense of the term; they were dependent peasants working for landlords.[3] Cloth production is an example of that specific phenomenon of Russian history—the employment of serf labour in industry. Since we are dealing only with the post-Reform period, the above brief remarks will suffice to show the way in which this phenomenon is reflected in factory statistics.[4] We shall now quote some figures drawn from statistics on steam-engines in order to estimate the development of large-scale machine production in this industry: in 1875-1878, in the wool-spinning and cloth industries of European Russia there were 167 mechanised establishments using 209 steam-engines with a total of 4,632 h.p., and in 1890 there were 197 establishments using 341 steam-engines with a total of 6,602 h.p. The use of steam power, therefore, did not make very rapid progress; this is to be explained partly by the traditions of landlord factories and partly by the displacement of felt cloth by the cheaper worsted and mixed fabrics.[5] In the years 1875-1878 there were seven mechanised establishments using 20 steam-engines with a total of 303 h.p., and in 1890 there were 28 mechanised establishments employing 61 steam-engines to a total of 1,375 h.p.[6]
In regard to the woollen-goods industry let us also take note of felt-making, a branch that shows in particularly striking fashion the impossibility of comparing factory statistics for different times: the figures for 1866 are 77 factories with a total of 295 workers, while for 1890 they are 57 factories with 1,217 workers. The former figure includes 60 small establishments employing 137 workers with an output of under 2,000 rubles, while the latter includes an establishment with four workers. In 1866 39 small establishments were recorded in Semyonov Uyezd, Nizhni-Novgorod Gubernia, where felt-making is now highly developed but is regarded as a “handicraft” and not a “factory” industry (see Chapter VI, § II, 2).
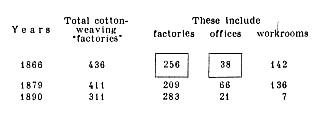
Further, a particularly important place in the textile trades is held by cotton processing, a branch which now employs over 200,000 workers. Here we observe one of the biggest errors of our factory statistics, namely, the combining of factory workers and capitalistically occupied home workers. Large-scale machine industry developed here (as in many other cases) by drawing home workers into the factory. It is obvious how distorted this process will appear if work-distributing offices and work rooms are classed as “factories,” if home workers are lumped together with factory workers! For 1866 (according to the Yearbook ) up to 22,000 home workers were included among factory workers (by no means the full number, for the Yearbook, evidently by pure accident, omits in the case of Moscow Gubernia those notes about “work from village to village” which are so abundant for Vladimir Gubernia). For 1890 (according to the Directory ) we found only about 9,000 such workers. Clearly, the figures given in the factory statistics (1866—59,000 workers in the cotton weaving mills; 1890—75,000) underrate the increase in the number of factory workers that actually took place.[7] Here are data showing what different establishments were classed at different times as cotton-weaving “factories”:[8]
Thus, the decrease in the number of “factories” shown by the “statistics” actually indicates the displacing of distributing offices and workrooms by the factory. Let us illustrate this by the example of two factories:
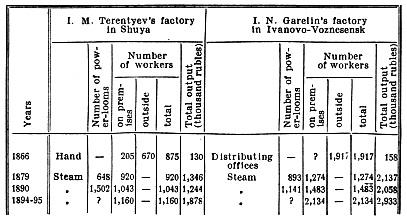
Hence, to assess the development of large-scale machine production in this branch of industry it is best to take the data giving the number of power-looms. In the 18609 there were about 11,000,[9] and in 1890 about 87,000. Large-scale machine industry was consequently developing at enormous speed. In cotton spinning and weaving there was recorded in 1875-1878 a total of 148 mechanised establishments, having 481 steam-engines totalling 20,504 h.p., and in 1890, 168 mechanised establishments, having 554 steam-engines with a total of 38,750 h.p.
Precisely the same mistake is made in Russian statistics in relation to linen production, wherein a decrease in the number of factory workers is erroneously shown (1866—17,171; 1890—15,497). Actually, in 1866, of 16,900 looms belonging to linen-mill owners only 4,749 were kept in their establishments, the remaining 12,151 being held by work room owners.[10] The number of factory workers for 1866, therefore, included about 12,000 home workers, and for 1890 only about 3,000 (computed from Directory ). The number of power-looms, however, grew from 2,263 in 1866 (computed from Military Statistical Abstract ) to 4,041 in 1890, and of spindles from 95,495 to 218,012. In flax spinning and linen-weaving in the years 1875-1878 there were 28 mechanised establishments, having 47 steam engines with a total of 1,604 h.p., while in 1890 there were 48 mechanised establishments, having 83 steam-engines with a total of 5,027 h.p.[11]
Lastly, of the textile trades mention should be made of dyeing, printing and finishing, in which trades the factory statistics combine factories and the very smallest handicraft establishments with only 1 or 2 workers each and an output of a few hundred rubles.[12] Naturally, this causes no little confusion and obscures the rapid growth of large-scale machine industry. The following figures reflect this growth: in the wool-cleaning, dyeing, bleaching and finishing trades in 1875-1878 there were 80 mechanised establishments with 255 steam-engines totalling 2,634 h.p.; in 1890 there were 189 mechanised establishments with 858 steam-engines totalling 9,100 h.p.
In this section the most reliable data are those on saw milling, although in the past small establishments were also included here.[13] The enormous development of this trade in the post-Reform period (1866—4 million rubles 1890—19 million rubles), accompanied by a considerable increase in the number of workers (4,000 and 15,000) and in the number of steam-powered establishments (26 and 430), is particularly interesting, in that it affords striking evidence of the growth of the lumber industry. Saw-milling is but one of the operations of the lumber industry, which is a necessary concomitant of the first steps of large-scale machine industry.
As to the rest of the trades in this section, namely, furnishing and carpentry, bast-matting, and pitch and tar—the factory statistics relating to them are distinguished for their particularly chaotic condition. The small establishments so numerous in these trades were formerly included among the “factories” in numbers fixed arbitrarily, and the same is sometimes done even today.[14]
The statistics on the chemical industry proper are distinguished for their relative reliability. The following returns show its growth: in 1857 chemical products were consumed in Russia to a total of 14 million rubles (3.4 million rubles home produced and 10.6 million rubles imported); in 1880, to a total of 36 1/4 million rubles (7 1/2 million rubles home produced and 28 3/4 imported); and in 1890, to a total of 42.7 million rubles (16.1 million rubles home produced and 26.6 imported).[15] These data are particularly interesting because the chemical industries are extremely important as producers of auxiliary materials for large-scale machine industry, i.e., articles of productive (and not personal) consumption. As to potash and saltpetre production, let us remark that the number of factories given is unreliable, again due to the inclusion of small establishments.[16]
The tallow trade has undoubtedly declined in the post-Reform period. Thus, the value of output of the tallow candle and tallow-boiling trade was estimated in 1866-1868 at 13.6 million rubles, and in 1890 at 5 million rubles.[17] This decline is to be explained by the growing use of mineral oils for lighting, which are displacing the old-time tallow candle.
For leather production (1866: 2,308 establishments with 11,463 workers and an output totalling 14.6 million rubles; 1890: 1,621 establishments with 15,564 workers and an output totalling 26.7 million rubles) statistics constantly lump together factories and small establishments. The relatively high cost of raw materials, which explains the high total output, and the fact that this trade requires very few workers, make it particularly difficult to draw a line of demarcation between the handicraft establishments and the factories. In 1890, of the total number of factories (1,621), only 103 had an output of less than 2,000 rubles; in 1879 there were 2,008 out of a total of 3,320[18]; in 1866, of 2,308 factories[19] 1,042 had an output of less than 1,000 rubles (these 1,042 factories employed 2,059 workers and had an output totalling 474,000 rubles). Thus, the number of factories increased, although the factory statistics show a decrease. As for the small leather establishments, their number is still very large today: for instance, The Factory Industry and Trade of Russia, published by the Ministry of Finance (St. Petersburg, 1893), gives a total of nearly 9,500 handicraft works, with 21,000 workers and an output of 12 million rubles. These “handicraft” establishments are much larger than those which in the 60s were included among “factories and works.” Since small establishments are included among the “factories and works” in unequal numbers in the different gubernias and in different years, the statistics on this trade should be treated with great caution. The steam-engine statistics for 1875-1878 gave for this industry 28 mechanised establishments with 33 steam-engines to a total of 488 h.p. and in 1890 there were 66 mechanised establishments with 82 steam-engines to a total of 1,112 h.p. In these 66 factories 5,522 workers (more than a third of the total) were concentrated with an output totalling 12.3 million rubles (46% of the total), so that the concentration of production was very considerable, and the productivity of labour in the large establishments far above the average.[20]
The ceramic trades fall into two categories in accordance with the character of the factory statistics: in some, there is hardly any combining of small-scale production with large. That is why these statistics are fairly reliable. This applies to the following industries: glass, porcelain and chinaware, plaster and cement. Particularly remark able is the rapid growth of the last-mentioned trade, which is evidence of the development of the building industry: the total output in 1866 was estimated at 530,000 rubles (Military Statistical Abstract ), and in 1890 at 3,826,000 rubles; the number of power-operated establishments in 1875-1878 was 8, and in 1890 it was 39. On the other hand, in the pottery and brick trades the inclusion of small establishments is observed on a tremendous scale, and for that reason the factory statistics are very unsatisfactory, being particularly exaggerated for the 60s and 70s. Thus, in the pottery trade in 1879 there were listed 552 establishments, with 1,900 workers and an output totalling 538,000 rubles, and in 1890, 158 establishments with 1,978 workers and an output totalling 919,000 rubles. If we subtract the small establishments (those with an output of less than 2,000 rubles) we get: 1879—70 establishments, with 840 workers and an output of 505,000 rubles; 1890—143 establishments, with 1,859 workers and an output of 857,000 rubles. That is to say, instead of the decrease in the number of “factories” and stagnation in the number of workers shown in the statistics, there was actually a considerable increase in both the one and the other. In brick-making the official data for 1879 showed 2,627 establishments, with 28,800 workers and an output totalling 6,963,000 rubles; for 1890—1,292 establishments, with 24,334 workers and an output of 7,249,000 rubles; and without the small establishments (those with an output of less than 2,000 rubles) we get for 1879—518 establishments, with 19,057 workers and an output of 5,625,000 rubles; and for 1890—1,096 establishments, with 23,222 workers and an output of 7,240,000 rubles.[21]
In the factory statistics for the metallurgical industries the sources of confusion are, firstly, the inclusion of small establishments (exclusively in the 60s and 70s),[22] and, secondly and mainly, the fact that metallurgical plants are “subject, not to the jurisdiction” of the Department of Commerce and Manufacture, but to that of the Department of Mines. The returns of the Ministry of Finance usually omit ironworks “on principle”; but there have never been uniform and invariable rules for the separation of ironworks from the other works (and it would hardly be possible to devise them). That is why the factory statistics published by the Ministry of Finance always include ironworks to some extent, although the actual degree to which they are included varies for different gubernias and for different years.[23] General data on the increased use of steam-engines in metallurgy since the Reform will be given below, when we deal with the mining and metallurgical industry.
These industries merit special attention for the question that concerns us, since the confusion in factory statistics attains here its maximum. And yet, these industries occupy a prominent place in our factory industry as a whole.
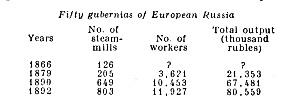
Thus, according to the Directory for 1890 these industries account for 7,095 factories, with 45,000 workers and an output totalling 174 million rubles out of a total for European Russia of 21,124 factories, with 875,764 workers and an output of 1,501 million rubles. The fact is that the principal trades of this group—flour-milling, groat milling and oil-pressing—consist of the processing of agricultural produce. There are hundreds and thousands of small establishments in Russia engaged in this processing in every gubernia, and since there are no generally established rules for selecting the “factories and works” from among them, the statistics pick out such small establishments quite fortuitously. That is why the numbers of “factories and works” for different years and for different gubernias fluctuate enormously. Here, for example, are the figures for the flour-milling trade for various years, as taken from various sources: 1865— 857 mills (Returns and Material of the Ministry of Finance ); 1866— 2,176 (Yearbook ); 1866—18,426 (Military Statistical Abstract ); 1885—3,940 (Collection ); 17,765 (Returns for Russia ); 1889, 1890 and 1891—5,073, 5,605 and 5,201[24] (Collection ); 1894-95—2,308 (List ). Among the 5,041 mills listed in 1892 (Collection ), 803 were steam-, 2,907 water-, 1,323 wind- and 8 horse-operated! Some gubernias counted only steam-mills, others included watermills (in numbers ranging from 1 to 425), still others (the minority) included also windmills (from 1 to 530) and horse-operated mills. One can imagine the value of such statistics, and of conclusions based on a credulous use of the data they provide![25] Obviously, to judge the growth of large-scale machine industry we must first establish a definite criterion for the term “factory.” Let us take as such a criterion the employment of steam-engines: steam-mills are a characteristic concomitant of the epoch of large-scale machine industry.[26]
We get the following picture of the development of factory production in this branch of industry.[27]
The statistics for the oil-pressing trade are unsatisfactory for the same reason. For instance, in 1879 2,450 works were listed with 7,207 workers and an output totalling 6,486,000 rubles, and in 1890 there were 383 works, with 4,746 workers and an output totalling 12,232,000 rubles. But this decrease in the number of factories and of workers is only apparent. If the data for 1879 and 1890 are made comparable, i.e., if we exclude establishments with an output of less than 2,000 rubles (not included in the lists) we get for 1879: 272 works, with 2,941 workers and an output totalling 5,771,000 rubles, and for 1890—379 works, with 4,741 workers and an output totalling 12,232,000 rubles. That large-scale machine industry has developed in this trade no less rapidly than in flour-milling is evident, for example, from the statistics for steam-engines; in 1875-1878 there were 27 steam-powered works, with 28 steam engines of 521 h.p., while in 1890 there were 113 mechanised works, with 116 steam-engines totalling 1,886 h.p.
The other trades of this group are relatively small. Let us note that in the mustard and fish-products trades, for instance, the statistics of the 60s included hundreds of small establishments such as have nothing whatever in common with factories and are now not classed as such. The extent to which our factory statistics for various years need correction is evident from the following: with the exception of flour-milling, the Directory for 1879 gave in this section a total of 3,555 establishments with 15,313 workers, and for 1890—1,842 establishments with 19,159 workers. For 7 trades,[28] small establishments (with an output of less than 2,000 rubles) were included as follows: in 1879—2,487 with 5,176 workers and an output totalling 916,000 rubles and in 1890, seven establishments, employing ten workers and with an output totalling two thousand rubles! To make the data comparable, one should, consequently, subtract in one case five thousand workers, and in the other, ten persons!
In some of the excise-paying trades we observe a decrease in the number of factory workers between the 1860s and the present day, but the decrease is not nearly as considerable as is asserted by Mr. N.–on,[29] who blindly believes every figure in print. The fact is that for the majority of excise-paying trades the only source of information is the Military Statistical Abstract, which, as we know, tremendously exaggerates the totals in the factory statistics. Unfortunately, however, we have little material with which to verify the data in the Abstract . In distilling, the Military Statistical Abstract counted in 1866 a total of 3,836 distilleries with 52,660 workers (in 1890—1,620, with 26,102 workers), but the number of distilleries does not coincide with the data of the Ministry of Finance, which in 1865-66 calculated 2,947 operating distilleries and in 1866-67—3,386.[30] Judging by this, the number of workers is exaggerated by some 5,000 to 9,000. In vodka distilling, the Military Statistical Abstract computes 4,841 distilleries, with 8,326 workers (1890: 242 distilleries with 5,266 workers); of these Bessarabia Gubernia has 3,207 distilleries with 6,873 workers. The absurdity of these figures is glaring. In fact, we learn from material published by the Ministry of Finance[31] that the actual number of vodka distilleries in Bessarabia Gubernia was 10 or 12, and in the whole of European Russia 1,157. The number of workers was consequently exaggerated by a minimum of 6 thousand. The cause of this exaggeration is, evidently, that the Bessarabian “statisticians” included vineyard owners among the owners of distilleries (see below on tobacco making). In beer- and mead-brewing, the Military Statistical Abstract counts 2,374 breweries, with 6,825 workers (1890—918 breweries, with 8,364 workers), whereas The Ministry of Finance Yearbook estimates a total of 2,087 breweries in European Russia for 1866. The number of workers is exaggerated here too.[32] In the beet-sugar and sugar-refining trades, the Military Statistical Abstract exaggerates the number of workers by 11 thousand, counting 92,126 persons, as against 80,919 according to the data of The Ministry of Finance Yearbook (1890—77,875 workers). In tobacco-making, the Military Statistical Abstract gives 5,327 factories, with 26,116 workers (1890— 281 factories, with 26,720 workers); of these, 4,993 factories with 20,038 workers are in Bessarabia Gubernia. Actually, the number of tobacco factories in Russia in 1866 was 343, and in Bessarabia Gubernia 13.[33] The number of workers has been exaggerated by about 20 thousand, and even the compilers of the Military Statistical Abstract themselves indicated that “the factories shown in Bessarabia Gubernia . . . are nothing but tobacco plantations” (p. 414). Mr. N.–on evidently thought it superfluous to glance at the text of the statistical publication he uses; that is why he failed to notice the error, and discoursed with a highly serious air about a “slight increase in the number of workers in the . . . tobacco factories” (article cited, p. 104)!! Mr. N.–on simply takes the total number of workers in the excise paying trades from the Military Statistical Abstract and the Directory for 1890 (186,053 and 144,332) and calculates the percentage of decrease. . . . “In a period of 25 years there has been a considerable drop in the number of workers employed. It has diminished by 22.4%. . . . “Here” (i.e., in the excise-paying trades) “we see no signs of an increase, the plain fact being that the number of workers has simply declined by a quarter of its previous magnitude” (ibid.). Indeed, what could be “simpler”! Take the first figure you lay your hands on, and calculate a percentage! As for the trifling circumstance that the figure given in the Military Statistical Abstract exaggerates the number of workers by some forty thousand, that can be ignored.
The criticism of our factory statistics given in the last two sections leads us to the following main conclusions:
1. The number of factories in Russia has been rapidly growing in the post-Reform period.
The opposite conclusion, which follows from our factory statistics, is erroneous. The point is that the figures we are given of factories include small artisan, handicraft and agricultural establishments, and the further back we go from the present day, the larger the number of small establishments included in the number of factories.
2. The number of factory workers and the volume of output of factories and works are likewise exaggerated for the past period in our statistics. This is due, firstly, to the fact that former]y a greater number of small establishments were included. Hence, the data for the industries that merge with handicrafts are particularly unreliable.[34] Secondly, it is due to the fact that in the past more capitalistically employed home workers were classified as factory workers than today.
3. It is customary in this country to think that if figures are taken from the official factory statistics they must be considered comparable with other figures taken from the same source, and must be regarded as more or less reliable, until the contrary is proved. What has been said above, however, leads to the opposite conclusion, namely, that all comparisons of our factory statistics for different times and for different gubernias must be regarded as unreliable until the reverse is proved.
[1] In all cases, unless otherwise stated, we take the data of the Yearbook for 1866 and those of the Directories for 1879 and 1890.—The Historico-Statistical Survey (Vol. II) gives annual information on cloth production from 1855 to 1879; the following are the five-year averages of workers employed from 1855-1859 to 1875-1879: 107,433-96,131- 92,117; 87,960 and 81,458.—Lenin
[2] See A Survey of Various Branches of Manufactory Industry in Russia, Vol. I, St. Petersburg, 1862, particularly pp. 165 and 167. Cf. also Military Statistical Abstract, D. 357 and foll. At the present time we rarely meet in the lists of cloth manufacturers the celebrated noble families that constituted the overwhelming majority in the 1860s.—Lenin
[3] The following examples are taken from Zemstvo statistical material. Concerning N. P. Gladkov’s cloth factory in Volsk Uyezd Saratov Gubernia (in 1866 it had 306 workers), we read in the Zemstvo statistical abstract for this uyezd (p. 275) that peasants were forced to work in the factory belonging to the lord. “They worked in the factory until they married, and then became tax-paying members of the peasant community.” In the village of Rvassy, Ranenburg Uyezd, Ryazan Gubernia, there was in 1866 a cloth factory employing 180 workers. The peasants performed their Corvée by working in the mill, which was closed down in 1870 (Statistical Returns for Ryazan Gubernia, Vol. II, Pt. I, Moscow, 1882, p. 330).—Lenin
[4] See Nisselovich, A History of the Factory Legislation of the Russian Empire, Pts. I and II, St. Petersburg, 1883-1884.—A. Semyonov, A Study of Historical Data on Russian Foreign Trade and Industry, St. Petersburg, 1858-1859, 3 parts.—V. I. Semevsky, The Peasants in the Reign of Catherine II, St. Petersburg, 1881.—Statistical Returns for Moscow Gubernia. Sanitary Statistical Sec, Vol IV, Pt. I (general summary), Moscow, 1890, article by A. V. Pogozhev, “The Manorial-Possessional Factories of Moscow Gubernia.”—M. Tugan-Baranovsky, The Russian Factory, St. Petersburg, 1898, Vol. I.—Lenin
[5] Cf. Successes of Russian Industry According to Surveys of Expert Commissions, St. Petersburg, 1897, p. 60.—Lenin
[6] The data on steam-engines in this and the following instances are taken from Material for the Statistics of Steam-Engines in the Russian Empire published by the Central Statistical Committee, St. Petersburg, 1882; for 1890 they are taken from Collection of Data on Factory Industry ; data on mechanised establishments are from the Directory.—Lenin
[7] Cf. Tugan-Baranovsky, loc. cit., p. 420.—The total number of village hand weavers working for capitalists was estimated by Semyonov at approximately 385,857 in 1859 (loc. cit., III, 273) to these he added another 200,000 village workers engaged “in other factory trades” (ibid., p. 302). At the present time, as we have seen above, the number of capitalistically employed home workers is much larger.—Lenin
[8] Establishments with an output of under 2,000 rubles are classed as workrooms. The data of the special investigation of factories and works in Moscow and Vladimir gubernias made in 1868 by the Central Statistical Committee contain the repeated statement that the output figures of the small weaving establishments merely indicate pay for work done. Establishments that distribute work to home workers are classed as offices. For 1866 the figure given for these establishments is far from complete, owing to obvious omissions in the case of Moscow Gubernia.—Lenin
[9] Military Statistical Abstract, 380.— Survey of Manufactory Industry, Vol, II, St. Petersburg, 1863, p. 451. —In 1898 the number of power-looms used in cotton weaving (for the whole Empire, evidently) was reckoned at 100,630. Successes of Russian Industry, p. 33.—Lenin
[10] Military Statistical Abstract, pp. 367-368: Commissariat returns.—Lenin
[11] In silk-weaving in 1879 there were 495 power-looms and 5,996 hand-looms (Historico-Statistical Survey), and in 1890 there were 2,899 of the former and over 7,500 of the latter.—Lenin
[12] For example, in 1879 the number of factories computed in these trades was 729; of this number, 466 had 977 workers and an output of 170,000 rubles. Even today one can find many such “factories”—for instance, in the description of the handicraft industries of Vyatka and Perm gubernias.—Lenin
[13] Cf. Military Statistical Abstract, p. 389. Survey of Manufactory Industry, I, 309.—Lenin
[14] Thus in 1879, of 91 bast-matting factories 39 had an output of less than 1,000 rubles each (Cf. Studies, p. 155). [See present edition Vol. 2, The Handicraft Census of 1894-95 in Perm Gubernia. –Ed.] In the pitch-and-tar trade for f890 there were computed 140 factories, all with an output exceeding 2,000 rubles; for 1879, 1,033 were computed, of which 911 had an output of less than 2,000 rubles; for 1866 the number listed was 669 (for the Empire), while the Military Statistical Abstract even gave the figure of 3,164!! (Cf. Studies, pp. 156 and 271.) [See present edition, Vol. 2, The Handicraft Census of 1894-95 in Perm Gubernia, and Vol. 4, “On the Question of Our Factory Statistics.” –Ed.]—Lenin
[15] Military Statistical Abstract, Historico-Statistical Survey and Productive Forces, IX, 16.—The number of workers in 1866—5,645; in 1890—25,471; in 1875-1878—38 mechanised establishments, with 34 steam-engines to a total of 332 h.p.; and in 1890—141 mechanised establishments, with 208 steam-engines to a total of 3,319 h.p.—Lenin
[16] Cf. Directory for 1879 and 1890 about potash production. The production of saltpetre is now concentrated in one factory in St. Petersburg, whereas in the 60s and 70s saltpetre was obtained from burti (dungheaps).—Lenin
[17] Here, too, the number of factories in the 60s and 709 included a host of small establishments.—Lenin
[18] In 1875, Prof. Kittary, in his Map of Leather Production in Russia, gave an aggregate of 12,939 establishments, with output totalling 47 1/2 million rubles, whereas the factory statistics gave 2,764 establishments, with output totalling 26 1/2 million rubles (Historico-Statistical Survey). In the fur trade, another in this section, a similar lumping is observed of small establishments together with factories: Cf. Directory for 1879 and for 1890.—Lenin
[19] The Military Statistical Abstract gave an aggregate of even 3,890!!—Lenin
[20] If we distribute the factories shown in the Directory as for 1890 according to date of establishment we get the following: of 1,506 factories the number established at dates unknown was 91, before 1850 —331; in the 1850s—147; in the 60s—239; in the 70s—320; in the 80s —351; in 1890—21. In every succeeding decade more factories were established than in the preceding one.—Lenin
[21] The small establishments in these industries are now classed with the handicrafts. Cf., for instance, the table of small industries (Appendix I) or Studies, pp. 158-159. (See present edition, Vol. 2, The Handicraft Census of 1894-95 in Perm Gubernia. –Ed.). The Ministry of Finance Yearbook (Vol. I) refused to give totals for these industries because the figures were obviously exaggerated. Progress in statistics since then is expressed in an increased boldness and disregard of the quality of material used.—Lenin
[22] Thus, in the 60s, dozens of smithies were classed for some gubernias as “ironworks.”– See Returns and Material of the Ministry of Finance, 1866, No. 4, p. 406; 1867, No. 6 p. 384.—Statistical Chronicle, Series II, Vol. 6.—Cf. also the example quoted above (§ II) where the Yearbook for 1866 includes the small handicraftsmen of the Pavlovo district among the “factory owners.”—Lenin
[23] See examples in Studies, p. 269 and p. 284 (see present edition, Vol. 4, “On the Question of Our Factory Statistics.” –Ed.), where Mr. Karyshev’s error in ignoring this circumstance is examined. The Directory for 1879, for instance, includes the Kulebaki and Vyksa ironworks, or departments of them (pp. 356 and 374), which are omitted in the Directory for 1890.—Lenin
[24] And in addition 32,957 “small windmills,” not counted among the “factories and works.”—Lenin
[25] See examples of such conclusions drawn by Mr. Karyshev in the above-quoted article in the Studies. (See present edition, Vol. 4, op. cit. –Ed.)—Lenin
[26] Large watermills are also in the nature of factories, of course, but we have no data to enable us to single them out from among the small ones. In the Directory for 1890 we saw listed 250 watermills each employing 10 and more workers. They employed 6,378 workers.—Lenin
[27] Military Statistical Abstract, Directories and Collection. According to the List for 1894-95, there are 1,192 steam-mills in European Russia. The statistics for steam-engines gave the number of steam-mills in European Russia in 1875-1878 as 294.—Lenin
[28] Oil-pressing, starch, treacle, malt, confectionery, preserves and vinegar.—Lenin
[29] Russkoye Bogatstvo, 1894, No. 6, pp. 104-105.—Lenin
[30] The Ministry of Finance Yearbook, I, pp. 76 and 82. The total number of distilleries (including those not in operation) was 4,737 and 4,646 respectively.—Lenin
[31] Yearbook, I, p. 104.—Lenin
[32] E.g., in Simbirsk Gubernia, the Military Statistical Abstract computes 218 distilleries (!) with 299 workers and an output totalling 21,600 rubles. (According to the Yearbook there were 7 distilleries in the gubernia.)Very likely, these were small domestic or peasant establishments.—Lenin
[33] The Ministry of Finance Yearbook, p. 61. Cf. Survey of Manufactory Industry (Vol. II St. Petersburg, 1863), which gives detailed information for 1861: 534 factories, with 6,937 workers; and in Bessarabia Gubernia, 31 factories, with 73 workers. The number of tobacco factories fluctuates greatly from year to year.—Lenin
[34] If we take the gross figures for all trades and for long periods, the exaggeration resulting from the cause mentioned will not be great, for the small establishments account for a small percentage of the total number of workers and the total output. It goes without saying that one presumes a comparison of figures taken from similar sources (there can be no question of comparing the returns of the Ministry of Finance with those of gubernatorial reports, or of the Military Statistical Abstract ).—Lenin
[35] The “landlord establishment of a manorial-possessional character ” was a feudal manorial manufactory belonging to a landlord and employing his serf-peasants. By a decree of Peter I issued in 1721, merchant factory owners were permitted to purchase peasants for work in their factories. The feudal workers attached to such enterprises were called “possessional peasants.” [p. 470]
| II. Our Factory Statistics | | | IV. The Development of the Mining Industry |
| Document Index | ||
| < Backwards | Forwards > | |||||
| Works Index | | | Volume 3 | | | Collected Works | | | L.I.A. Index |